8 Best AI Stock Screeners in 2026: Ranked and Compared
Reviewed by Marcus Delray, Founder and Fintech Analyst · Verified with official platform documentation – Updated July 2026
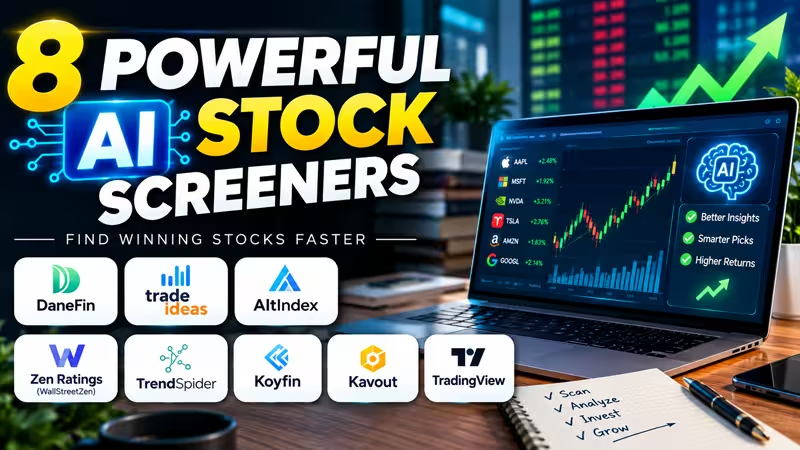
- The best AI stock screeners in 2026 are Danelfin (value investing),
- Trade Ideas (day trading), Zen Ratings (long-term simplicity),
- TrendSpider (technical analysis), Koyfin (fundamental research),
- AltIndex (alternative data), Kavout (multi-model consensus), and
- TradingView (all-in-one for beginners).
An AI stock screener uses machine learning to chew through market data — alternative data, SEC filings, sentiment, technical patterns — and flags opportunities before they show up in the numbers everyone else is staring at.
If you want the full picture of how AI is reshaping investing from the ground up, our AI stock trading guide for smart investors covers every layer — before you dive into specific tools like screeners.
AI is also transforming the operational side of finance, from bookkeeping to reconciliation, so if you want the broader picture beyond investing tools, see our guide to top AI accounting software for modern finance teams.
Look, I’ll be upfront with you.
I wasted a lot of time before I figured this stuff out. We’re talking months of manually pulling up company after company, running the same filters everyone else was running, and wondering why my picks weren’t performing any better than just buying an index fund and calling it a day.
The thing nobody really tells you when you start investing is that the tools most people use — the free screeners, the basic filters — they’re fine. They work. But they’re also being used by literally millions of other people at the same time. So whatever “edge” you think you have? It’s not really an edge. It’s just noise.
That’s where this platform started changing things for me personally. And I’m not talking about some magical system that predicts the future. I’m talking about tools that process information faster and smarter than any human possibly could, and then surface opportunities you’d have never found on your own.
Let me walk you through the ones actually worth your time in 2026.
Table of Contents
Why Your Current Screener Probably Isn’t Cutting It Anymore
Here’s a question worth sitting with. When you filter for stocks with low P/E ratios and strong earnings growth — who else do you think is running that same search?
Everyone. That’s who.
Finviz, Yahoo Finance, even the slightly fancier tools — they all work the same basic way. You set parameters. They filter. You get a list. The problem is it’s the same list thousands of other investors pulled this morning, last night, and the week before that.
An AI screener does something different. Instead of filtering what already happened, it tries to predict what’s about to happen. It chews through data that no human could realistically process — satellite images showing how full retail parking lots are, job posting trends that hint at where a company is heading, social media sentiment shifting weeks before earnings, supply chain signals buried in obscure reports.
And the newer platforms in 2026 have actually gotten good at showing you why they’re flagging something. Early AI tools were infuriating in this way — you’d get a signal with zero explanation, zero context. You were just supposed to trust it. The better tools now break down every recommendation into plain language. That matters a lot when real money is on the line.
The 8 Best AI Stock Screeners in 2026, Reviewed
Danelfin — Best for Value Investing
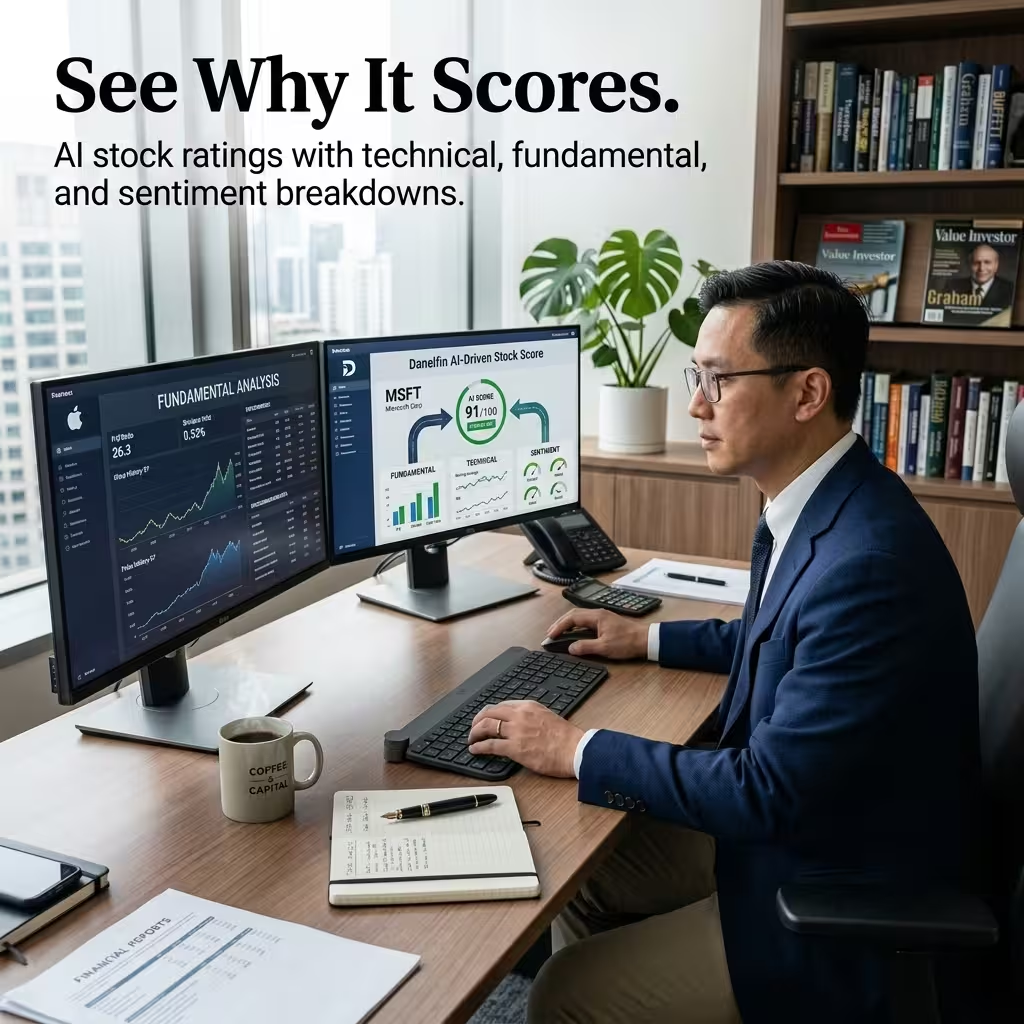
Danelfin scores stocks 1 to 10 on their probability of beating the market over the next three months, then breaks that score down into technical, fundamental, and sentiment “Alpha Signals” so you can see what’s driving it. It’s the most transparent scoring system on this list.
🟢 Danelfin Pros
- High Transparency: Breaks down scores by technicals, fundamentals, and sentiment.
- Proven Track Record: Premium 10/10 stock picks boast solid long-term outperformance.
- Free Option: Offers a helpful basic tier for beginner investors.
🔴 Danelfin Cons
- Short-Term Focus: AI scores target a tight three-month market outlook.
- Paywall Limits: The best Alpha Signals require a paid plan.
I’ll just say it — if I had to pick one platform for someone serious about value investing, this would be the one I’d point them toward.
Danelfin scores stocks 1 to 10 based on the probability of beating the market over the next three months. Pretty standard so far. But then it does something most stock pickers don’t bother with — it shows you the breakdown. They call these Alpha Signals, and they split out how much of the score came from technical indicators, how much from fundamentals, how much from sentiment.
So you’re not just staring at a number hoping it’s right. You can actually look under the hood and decide if the reasoning makes sense to you.
As far as track record goes — US stocks that hit a 10/10 score have shown annualized outperformance of over 21% since 2017. That’s a meaningful number tracked over a decent stretch of time, not a cherry-picked six-month window.
Best fit: Value investors, anyone who needs to understand the why before acting
Trade Ideas — Best for Day Trading
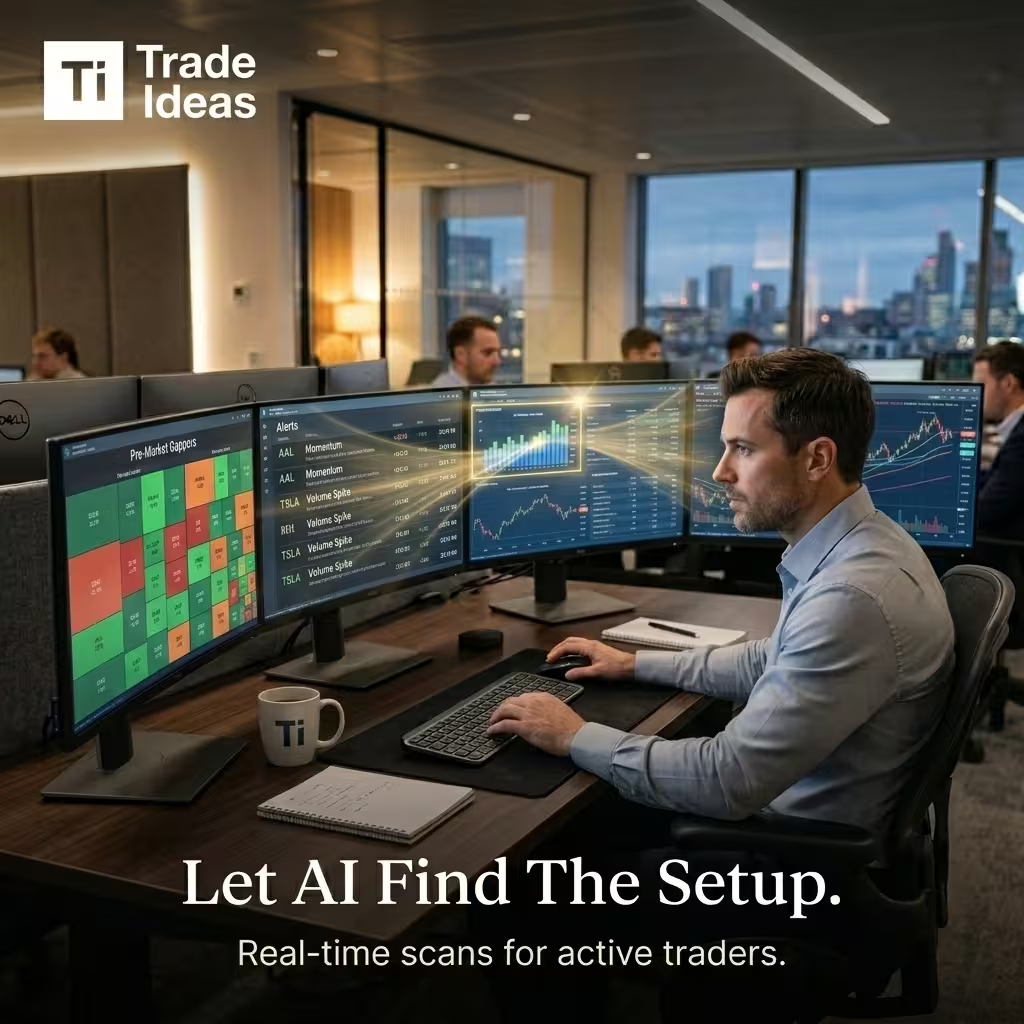
Trade Ideas is a real-time AI scanner built for active day traders, powered by an engine called Holly that runs millions of overnight simulations and delivers specific entry prices, targets, and stop-losses before the market opens. Pricing starts at $89/mo.
🟢 Trade Ideas Pros
- Real-Time Alerts: Provides live entry and exit signals during market hours.
- Automated Backtesting: Holly AI runs millions of simulated setups overnight.
- Complete Plan: Gives exact prices for risk stop-losses and targets.
🔴 Trade Ideas Cons
- High Cost: At $89 per month, it is an expensive subscription tool.
- Steep Learning Curve: The heavy data dashboard can overwhelm beginners.
Different tool entirely from everything else on this list. Trade Ideas isn’t really trying to help you find the next great long-term holding. It’s built for people who are actively trading positions on a daily basis.
The AI behind it is called Holly. Every single night, Holly runs millions of simulated trades — and by the time markets open, she’s already identified the best setups for the day, complete with entry prices, targets, and stop-losses. During market hours, the scanning continues in real time.
I’ll be honest — $89 a month is a commitment. But if you’re actively trading every day, the alternative is doing all of this manually. And nobody has time for that.
Best fit: Day traders, momentum traders, active retail investors working positions daily
AltIndex — Best for Alternative Data and Early Stock Signals
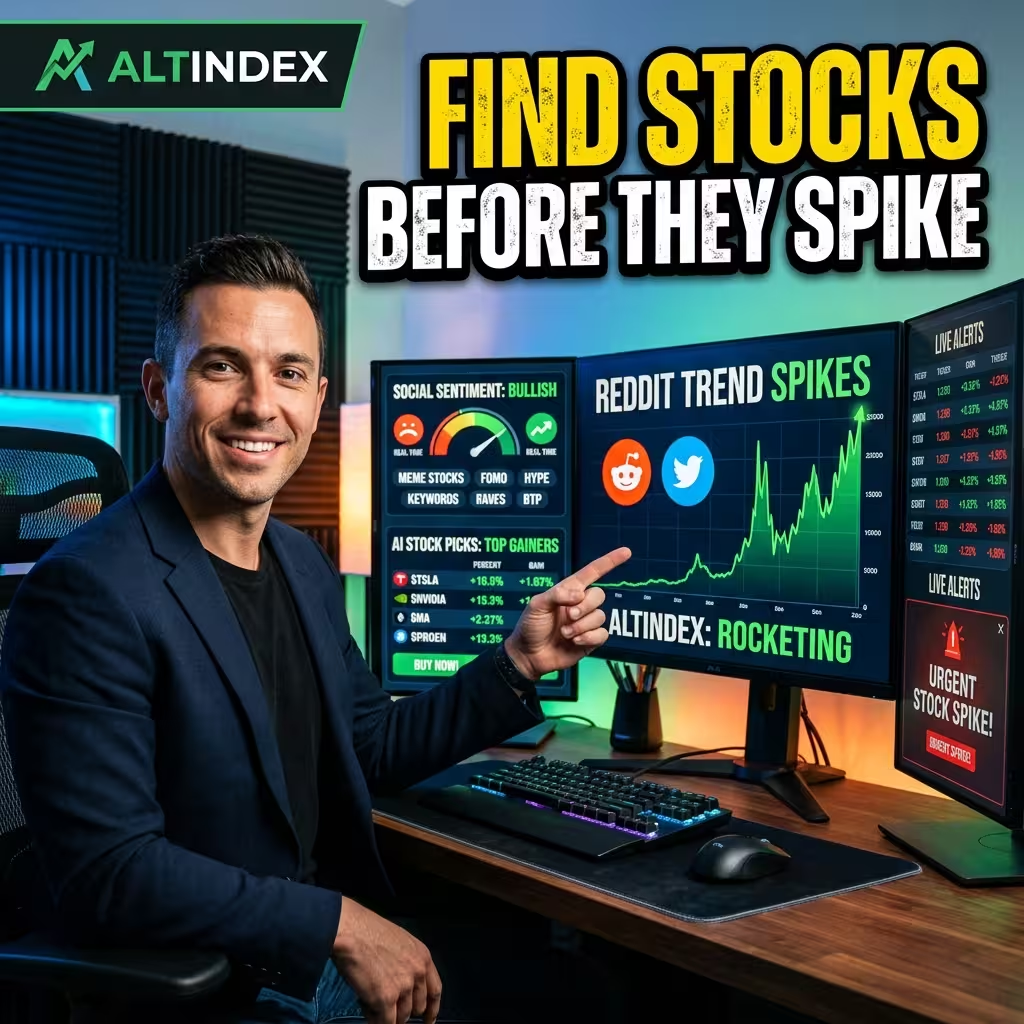
AltIndex analyzes a company’s “digital footprint” — app downloads, social engagement, job postings, web traffic, even card-spending data — to catch momentum weeks before it shows up in an earnings report. None of this lives on a balance sheet.
🟢 AltIndex Pros
- Unique Edge Data: Tracks app downloads, jobs, and social growth.
- Early Signals: Catches web traffic trends before quarterly earnings drop.
- Great Free Tier: Offers real utility without an upfront financial commitment.
🔴 AltIndex Cons
- No Chart Features: Does not feature classic technical chart tracking.
- New Metrics: Alternative web footprint data requires a slight learning curve.
This one is worth paying close attention to, especially if you’re interested in getting ahead of earnings surprises.
AltIndex tracks what it calls the “digital footprint” of a company. TikTok engagement trends. App download rates. Job postings. Credit card spending data pulled from real consumer behavior. None of this shows up on a balance sheet. But all of it tends to show up weeks or even months before official financial results do.
If a company’s app downloads are climbing fast and they’re hiring aggressively, something is probably going well at that business before the quarterly report tells the world about it. That gap between what the data is showing and what the market has priced in — that’s the edge.
There’s also a free tier, which is genuinely useful and not just a watered-down teaser. Good starting point for investors who want to dip into alternative data without a big subscription commitment upfront.
For a dedicated look at how AI reads news and social sentiment to move markets — including free tools for retail investors — see our guide to AI market sentiment analysis.
Best fit: Growth investors, earnings surprise hunters, anyone wanting early signals
Zen Ratings — Best for Simple Long-Term Wealth Building
Zen Ratings compresses 115 fundamental and market factors into a single letter grade, aimed squarely at long-term investors who don’t want to live inside a charting dashboard. It is built specifically for long-term investors who want high-conviction stock data without navigating complex technical charts or overwhelming spreadsheet dashboards. You get an A-through-F verdict instead of a spreadsheet.
🟢 Zen Ratings Pros
- Ultimate Simplicity: Employs clear letter grades for fast decision making.
- Deep Data History: Offers over twenty years of verified testing through market crashes.
- Massive Factors: Screens across 115 separate data metrics automatically.
🔴 Zen Ratings Cons
- No Charting Tools: Missing technical graph analysis features entirely.
- Active Trading Gap: Poor option for fast daily swing traders.
Here’s one that flies under the radar a bit but has arguably the most impressive long-term numbers on this list.
Zen Ratings evaluates thousands of stocks across 115 different factors and then — and this is where it gets refreshingly simple — it spits out a letter grade. A-rated stocks have returned around 32.5% annualized going back to 2003. That’s over two decades of data across every kind of market condition you can imagine. Recessions, crashes, bubbles, recoveries. All of it.
You don’t need to dig into the 115 factors yourself. That’s the whole point. The platform does the heavy lifting and gives you something you can actually act on without spending three hours analyzing it.
For US investors focused on building long-term wealth rather than catching intraday momentum swings, this one is worth bookmarking.
Best fit: Long-term investors, people who want high conviction without high complexity
TrendSpider — Best for Automated Technical Analysis
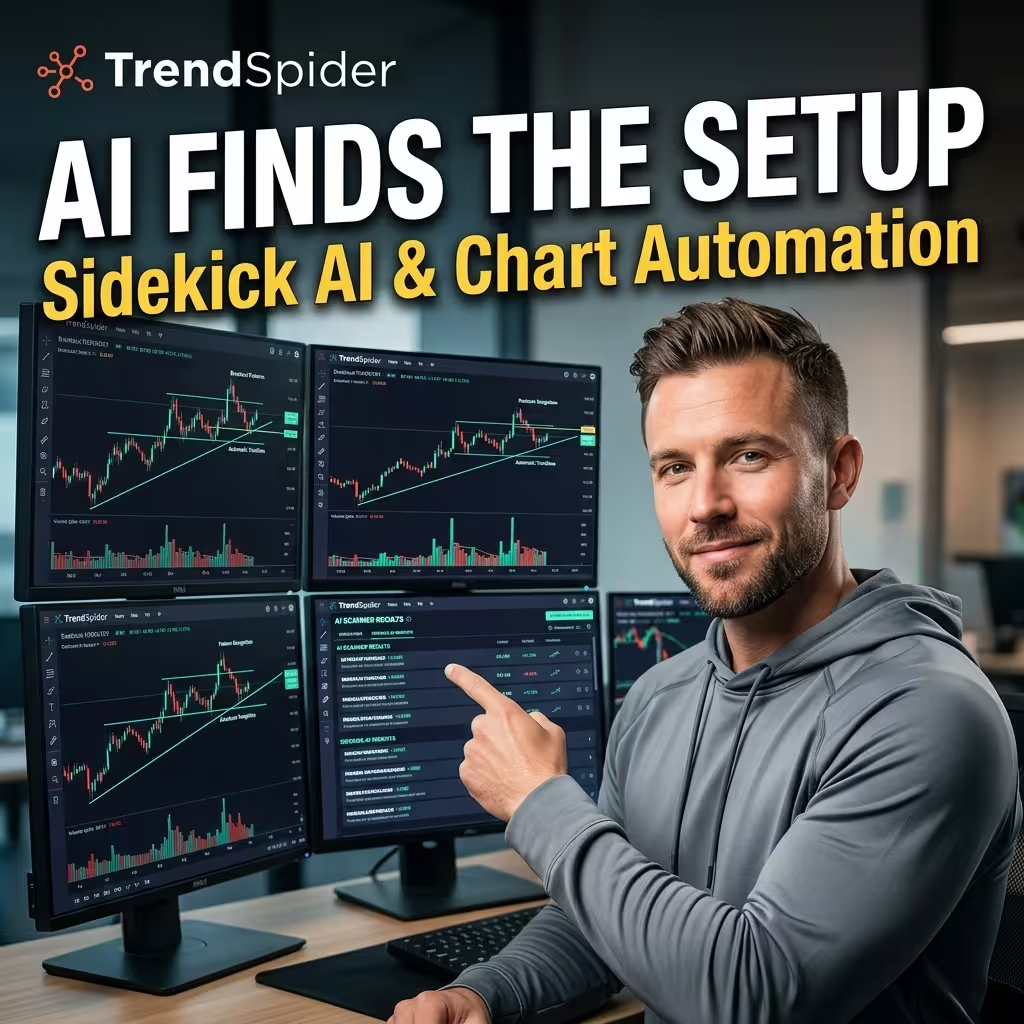
TrendSpider automates technical analysis by auto-detecting over 220 chart patterns and more than 150 candlestick formations, and lets you scan the market in plain English through its Sidekick AI feature. No manual drawing, no dropdown mazes.
🟢 TrendSpider Pros
- No Manual Drawing: AI automatically plots lines and technical candlestick shapes.
- Natural Language: Sidekick AI lets you text search for chart setups.
- Zero Code Models: Build and test custom scripts without code.
🔴 TrendSpider Cons
- Technical Focus Only: Not designed for deep corporate fundamental analysis.
- Mobile Limits: The platform works best on desktop screens.
I used to draw trendlines manually. I am not proud of how long I did that before I found something better.
TrendSpider automates the entire technical analysis side of things. More than 220 chart patterns. Over 150 candlestick formations. Identified automatically, no manual drawing required. Its AI Strategy Lab lets you train custom models on your preferred setups — and you don’t need to write a single line of code to do it.
The Sidekick AI feature is the one I find myself showing people when they ask for a demo. You just type what you’re looking for in plain English — something like “show me stocks breaking out on heavy volume with a clean base” — and it returns results. That’s it. No filter menus, no dropdown hell.
Best fit: Technical traders, swing traders, chart-focused investors
Koyfin — Best for Deep Fundamental Research
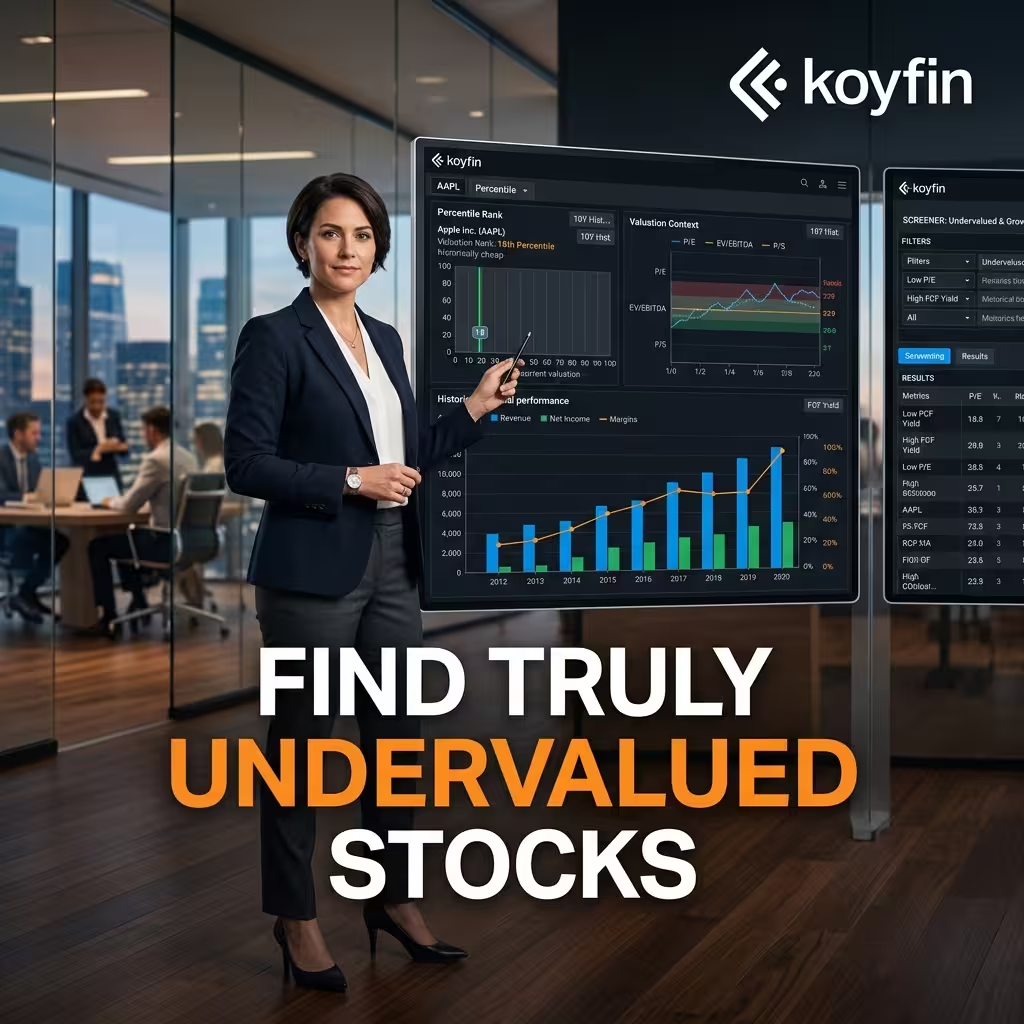
Koyfin tracks over 500 corporate metrics across more than a decade of financial history per company, and uses AI-driven valuation percentiles to rank a stock’s current price against its own past and its peers. It’s terminal-grade research without the terminal price.
🟢 Koyfin Pros
- Deep Metric Pool: Screens across 500 corporate financial data points.
- Valuation Context: Percentile rankings instantly highlight historic discounts.
- Clean Dashboards: Beautiful data graphing that replaces expensive terminals.
🔴 Koyfin Cons
- No Trade Automation: Cannot execute algorithmic auto-trades natively.
- Data Heavy: Demands an understanding of complex balance sheets.
If you’re doing real fundamental research, Koyfin is where you want to be doing it.
Over 500 metrics. More than ten years of historical financial data per company. And the feature that I think gets underrated — Percentile Ranks. This puts any metric you’re looking at on a 0-to-100 scale compared to the company’s own history or its industry peers.
Here’s why that matters. Knowing a stock has a P/E of 13 is one thing. Knowing that a P/E of 13 puts it in the 6th percentile of its own 10-year range — meaning it’s cheaper than 94% of the time over the last decade — that’s a completely different level of information. That’s the kind of context that actually tells you whether something is undervalued or just broken.
Best fit: Value investors, anyone trying to screen for genuinely undervalued stocks
Kavout — Best for Multi-Model Trade Consensus
Kavout runs several independent strategy models on the same stock and flags the ones they all agree on, then boils it down to a simple 1-to-9 “Kai Score.” It pulls from SEC filings, satellite data, and alternative economic indicators under the hood.
🟢 Kavout Pros
- Multi-Model Consensus: Combines value, growth, and momentum models for safer picks.
- Alternative Data: Uses satellite imagery and SEC filings to find trends.
- Simple Scores: Provides an easy-to-read 1-to-9 Kai Score.
🔴 Kavout Cons
- Hidden Logic: Backend AI calculations can feel complicated to track.
- Active Trading Gap: Not optimized for rapid intra-day scalping.
Kavout does something I find genuinely clever. It doesn’t just run one AI strategy on a stock. It runs several completely different ones — value-focused, momentum-focused, quality-focused, growth-focused — and if five or more of them independently land on the same stock, it flags that as a “Golden Trade.”
They call this the “Most Agreed” feature, and conceptually it makes a lot of sense. It’s sort of like asking five analysts who work in completely different ways and don’t talk to each other, and if they all say the same thing — you probably shouldn’t ignore that.
The platform itself pulls from SEC filings, satellite data, alternative economic indicators. It’s a lot of data crunching under the hood. The output is what they call a Kai Score — a simple 1-to-9 rating. Easy to act on, even if the backend is anything but simple.
If you’re the type who needs multiple signals confirming something before you feel comfortable acting, Kavout is probably built for you.
Best fit: People who want consensus before they commit capital
TradingView — Best Comprehensive Charting and Community Tool
TradingView is a charting, screening, and community platform used by over 100 million investors, combining live screeners, global market data, custom scripting, and a huge social network in one interface. It leans more rule-based than predictive-AI, but the breadth is unmatched.
🟢 TradingView Pros
- All-In-One Toolkit: Merges global charts, scripts, and screeners together.
- Massive Community: Millions of public indicators shared by active users.
- Broker Links: Supports direct trade execution from chart screens.
🔴 TradingView Cons
- Not Pure AI: Relies more on classic rule filters than predictive AI models.
- Ad Interruptions: Free account tiers feature heavy pop-up advertisements.
More than 100 million people use TradingView. Probably some of them are in your feeds already talking about it.
There’s a reason for the popularity. It’s not just a charting tool — it’s charting, screening, news, community analysis, broker integration, and custom scripting all in one place. The Pine Script v6 language lets you build and share custom indicators. The community library alone has tools built by thousands of contributors.
If you want one platform that does most things reasonably well without juggling separate subscriptions, TradingView is still the benchmark everything else gets measured against.
Best fit: All levels, especially investors who want community plus charts in one place
How We Evaluated
I want to be honest about how I sorted this list, because “best” is a lazy word when nobody tells you the criteria.
I wasn’t grading these on feature count. A tool can have 400 features and still be useless if you never open it. What I actually cared about came down to a handful of things:
- What data goes in. Technicals only? Fundamentals? Alternative data nobody else is watching? The input decides the edge.
- Whether it shows its work. This is the one that separates the tools I trust from the ones I don’t. If a platform flags a stock and won’t tell me why, I’m being asked to gamble on faith. Hard pass.
- Whether it’s honestly built for who it claims to serve. A lot of tools market to “everyone.” Almost none of them serve everyone well.
- Whether the track record survives scrutiny. A big number over six months means nothing. A decent number across a decade of crashes and recoveries means something.
- Whether a normal person can afford and use it. Institutional-grade is worthless if the price tag or the learning curve locks you out.
None of these made the list because someone paid to be here. Where affiliate links exist, they’re disclosed per site policy — and it changed exactly zero rankings.
How I’d Actually Combine These If Starting Fresh Today
Eight tools sounds like a lot. You don’t need all of them. But knowing how they fit together is useful.
Here’s the workflow I’d suggest:
1. Start with AltIndex and look for early signals — companies where the digital footprint data is moving in an interesting direction before the market picks up on it.
2. Take whatever looks interesting over to Kavout or Danelfin to see if the quant models agree. When alternative signals and AI probability scores point at the same stock — that’s worth investigating further.
3. Then look at the chart in TrendSpider. Confirm the technical picture is clean. A solid fundamental setup in a broken chart is still a bad trade.
4. Finally, run it through Koyfin. Check the valuation in historical context. Make sure you’re not buying into a story the market has already fully priced in.
Start to finish, that process takes maybe 20-30 minutes per stock once you have the tools set up. Before, it would’ve taken me most of a morning and I still wouldn’t have had this much information.
Once you’ve used screeners to build your shortlist, the next step is automating your entries and exits — our guide to the best algorithmic trading platforms covers the top no-code options.
A Few Things Worth Being Honest About
None of this is a guarantee. The track records these platforms publish are real. The historical data checks out. But past performance in investing is genuinely not predictive of future results in any individual case. Markets change, conditions shift, and even good AI models can be wrong.
Overfitting is something worth understanding. A lot of these AI models were trained heavily on data from the 2010s bull market. They do well in stable, trending conditions. Whether they hold up equally well in genuinely ugly markets is still something being tested in real time.
Taxes don’t disappear because a bot made the trade. Every profitable position is a taxable event, regardless of how it was executed. Tools like Koinly can help you track and calculate everything across the year. But the obligation is yours, not the algorithm’s.
And honestly — more tools isn’t always the answer. I know it’s tempting to subscribe to everything on this list and build some elaborate system. Two or three tools you actually understand and use consistently will beat eight tools you’re half-paying attention to almost every time.
Which AI Stock Screener Should You Start With?
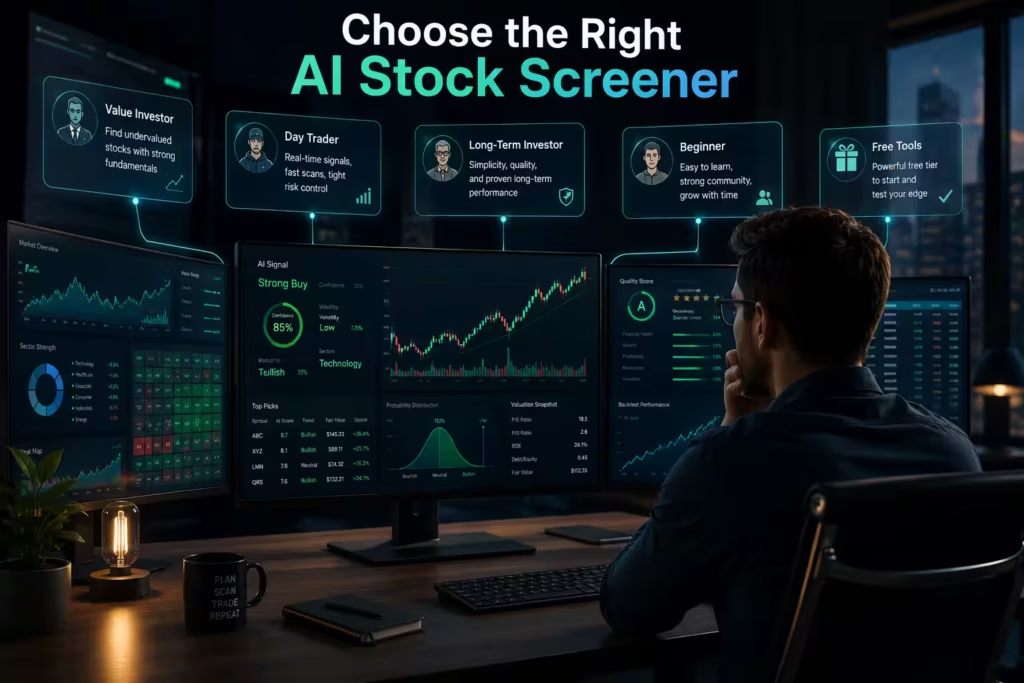
Value investor hunting undervalued stocks?
Danelfin plus Koyfin is a seriously capable pairing — one for the probability read, one for the valuation context. Start there.
Day trader who needs live signals?
Trade Ideas was built for exactly your use case, stop-losses and all.
Long-term investor who wants simplicity without giving up quality?
Zen Ratings. One letter grade, two decades of scarred backtesting behind it.
Not ready to spend a dime yet?
AltIndex’s free tier is real, and TradingView’s free version outclasses most paid tools from five years back — making them the best free screener combo to test-drive.
Complete beginner who wants to learn on the job?
TradingView, no contest. The community will teach you faster than any solo algorithm, and it’s the best AI stock screener for beginners for exactly that reason.
Pick based on how you already think about markets — not based on which tool has the most impressive feature list. The best AI stock screener is the one you’ll actually open tomorrow morning before you start looking at positions. Most investors are still running Yahoo Finance filters from five years ago. If you’re not, that’s already an edge.
People Also Ask
Q: What is an AI stock screener?
An AI stock screener is a software tool that uses machine learning and artificial intelligence to analyze large volumes of market data — including price history, fundamentals, alternative data, and sentiment — and automatically surface stocks that meet specific investment criteria. Unlike traditional screeners that filter based on fixed rules, AI screeners identify patterns and make predictions based on historical data.
Q: Which is the best in 2026?
The best AI tool for stock investment in 2026 depends on your trading style. Danelfin is the top pick for value investors, Trade Ideas leads for day traders, Zen Ratings excels for long-term simplicity, and TradingView is the strongest all-in-one option for beginners. There is no single best tool for every investor — the right choice is the one that fits how you already approach markets.
Q: What is the best AI stock screener for beginners?
TradingView is the best AI stock screener for beginners. It combines charting, screening, a large community library, and a strong free tier in a single platform. AltIndex is also a good entry point for beginners interested in alternative data, as its free tier provides genuine utility without requiring a financial commitment upfront.
Q: What is the best free AI tool for stocks investment?
AltIndex and TradingView. AltIndex’s free tier tracks real alternative data signals — including app downloads and web traffic trends — without requiring a subscription. TradingView’s free plan provides access to live charts, a screener, and one of the largest trading communities available online.
Q: Are these tools accurate?
These platforms can produce meaningful results based on historical data, but accuracy varies by platform and market condition. According to Danelfin’s published data, US stocks rated 10/10 have shown annualized outperformance of over 21% since 2017. According to Wall Street Zen’s backtesting data, Zen Ratings A-rated stocks have returned approximately 32.5% annualized since 2003. However, past performance does not guarantee future results, and all AI models carry the risk of overfitting to historical market conditions.
Q: Can these tools beat the market?
These platforms can help investors identify stocks with higher probabilities of outperforming the market, but no tool guarantees consistent market-beating returns. Historical backtests from platforms like Danelfin and Zen Ratings show strong long-term outperformance in their top-rated stocks, but real-world results depend on how an investor uses the signals, the current market environment, and other factors outside the AI’s control.
Q: What is the AI Tool for day trading?
Trade Ideas is the best platform for day trading. Its Holly AI engine runs millions of overnight simulations and delivers specific trade setups — including entry prices, profit targets, and stop-loss levels — before the market opens each morning. It also provides real-time scanning and alerts throughout market hours. Pricing starts at $89 per month.
Q: What is the best tool for value investing?
Danelfin is the best for value investing. It scores stocks 1 to 10 based on their probability of beating the market, and breaks down each score by technical, fundamental, and sentiment factors so investors can evaluate the reasoning — not just the output. Koyfin is a strong complement, offering over 500 metrics and 10+ years of historical data with valuation percentile rankings.
This article is for informational and educational purposes only. Nothing here constitutes financial advice. Always conduct your own research and consult a licensed financial advisor before making any investment decisions.
About the Author
Marcus Delray · Fintech Analyst, AI Investing Researcher & Founder

Marcus Delray
Fintech Analyst, AI Investing Researcher & Founder
Marcus Delray is a fintech analyst and founder of Tech Capital Hub, where he covers AI investing tools, stock screeners, market sentiment platforms, blockchain technology, DeFi, and business finance software. He researches how emerging financial technologies translate into real-world decision-making, helping investors, entrepreneurs, and finance professionals compare platforms, understand tradeoffs, and act with more confidence.
- Over a decade researching fintech platforms, AI-powered finance tools, and digital investing products
- Covers AI stock screeners, market sentiment systems, algorithmic trading platforms, and valuation research workflows
- Publishes independently researched, educational content designed to make complex financial technology easier to evaluate
Our Editorial Standards
How we apply experience, expertise, authoritativeness, and trust
Tech Capital Hub follows Google’s E-E-A-T framework so you can trust what you read. Here is how we work across four core areas.
First-Hand Testing
We personally test and research the AI stock screeners and fintech tools we cover. Every review reflects hands-on use of dashboards, scoring models, and alerts — not just marketing copy. When a platform falls short, we say so.
Deep Fintech Knowledge
Our coverage is built on years of work in AI investing, fintech analysis, and financial technology. We break down complex features like alternative data, valuation percentiles, and AI scoring into plain language you can actually use.
Credible Sourcing
We cite official platform documentation, pricing pages, and feature specs alongside SEC investor education and trusted industry references. Claims about performance and features are tied back to primary sources whenever possible.
Transparent & Accountable
We disclose affiliate relationships, fact-check every article, and keep content updated as tools change. Nothing here is financial advice, and we welcome corrections through our editorial team so the record stays accurate.
Fact Checked & Reviewed
Verified against official platform documentation and investor-education sources
✓ Verified 2026
Fact Checked & Reviewed
Verified against official platform documentation and investor-education sources
Sources Checked
- Best AI Stock Screeners in 2026 — Tech Capital Hub Primary Source
- Danelfin — Official Pricing & Plans
- Trade Ideas — Holly AI Overview
- Koyfin — Platform Features
- AltIndex — Stock Alerts & Alternative Data
- WallStreetZen — Zen Ratings Methodology
- TradingView — Markets & Charting Data
- SEC — Investor Education Resources
Each claim was checked against the sources above. Platform features, pricing, and data coverage change over time, so verify current details directly with each provider. This content is educational and is not financial advice.
Editorial Integrity
Sources, citations, and official reference material
Sources & Citations
Official Platform Documentation, Product Pages & Investor Education Sources
Tech Capital Hub evaluates AI stock screeners using publicly available product pages, official feature documentation, pricing pages, and investor-education resources. Platform features, pricing, data coverage, and AI capabilities can change over time, so readers should verify current details directly with each provider before subscribing or making investment decisions.
- Danelfin: Official pricing and plan details — used to verify availability of free and paid tiers.
- Trade Ideas: Holly AI overview — reference for AI-generated trade ideas, entry/exit signals, and market scanning.
- TrendSpider: Official feature and product pages — used to verify AI-powered charting, pattern recognition, and technical analysis capabilities.
- Koyfin: Platform features and financial analysis tools — referenced for valuation, company financial data, and research workflows.
- AltIndex: Stock alerts and alternative-data signals — referenced for app downloads, web traffic, hiring trends, and other early-signal data.
- WallStreetZen: Zen Ratings methodology overview — used to verify the multi-factor stock rating framework.
- TradingView: Market data and community features — referenced for charting, market coverage, and community functionality.
- SEC Investor Education: Investor education materials from the U.S. Securities and Exchange Commission — referenced to reinforce that research tools do not replace independent due diligence or personalized financial advice.
Enjoying our content?
Click below to add us as a preferred source. Google will prioritize our latest articles in your Top Stories, AI Mode, and AI Overviews.
Preferred Source on Google