
AI Cash Flow Forecasting Accuracy: Metrics, Benchmarks, and How to Improve It

Fintech Analyst · Founder of Tech Capital Hub
Marcus has spent more than a decade researching AI-powered financial modeling and forecasting systems. In this guide, he breaks down AI cash flow forecasting accuracy — how to measure it with MAPE and RMSE, what benchmarks to target by model and business size, and the practical steps that turn an unreliable forecast into one you can genuinely build decisions on.
Bottom line up front: AI cash flow forecasting is significantly more accurate than manual spreadsheet methods — but only when the right metrics, models, and data foundations are in place. This guide explains exactly how accuracy is measured, what good performance looks like by model type and business size, and the proven moves that close the error gap.
If you need the broader foundation first — what the technology is and which tools exist — start with our pillar guide to AI cash flow forecasting, then come back here for the deep dive on trust and precision.
A forecast is only as good as its error rate. A number that’s confidently wrong can cost you payroll, trigger an unnecessary credit draw, or send you into a panicked overdraft. Here’s the full picture — metrics, benchmarks by model and business size, and the improvement playbook that turns a shaky forecast into one you can build decisions on.
Table of Contents
Why Forecast Accuracy Is the Metric That Actually Matters
A forecast you don’t trust is just decoration. Accuracy is the single factor that decides whether you act on a number or quietly ignore it. Dashboards, scenario buttons, and slick interfaces mean nothing if the underlying prediction is off.
That’s why cash flow forecast accuracy deserves attention above any feature list. It’s the difference between managing cash proactively and reacting to a crisis after it lands.
What “accurate enough” really means for cash decisions
Decision-grade accuracy is the threshold where a forecast is tight enough to act on. For most short-range cash decisions, that means landing within roughly 5% of actuals.
Once error creeps past 15–20%, the forecast becomes a rough directional hint, not a planning tool. Past 30%, you’re flying blind while feeling informed — which is arguably worse than knowing you don’t know.
The goal of chasing better AI cash flow forecasting accuracy isn’t perfection. It’s crossing the decision-grade line reliably, week after week.
The hidden cost of a wrong forecast
A concrete example: your model projects $500,000 in your account 30 days out. You greenlight a hire, delay drawing on your credit line, and approve a supplier prepayment. The real number comes in at $350,000 — a 30% miss.
You’re now short $150,000 on committed obligations. You scramble for an emergency credit draw at an unfavorable rate and delay a vendor, straining the relationship. That wasn’t a spending problem. That was a cash flow forecasting error rate problem. The money math was fine. The picture of the future was wrong.

How AI Cash Flow Forecast Accuracy Is Measured
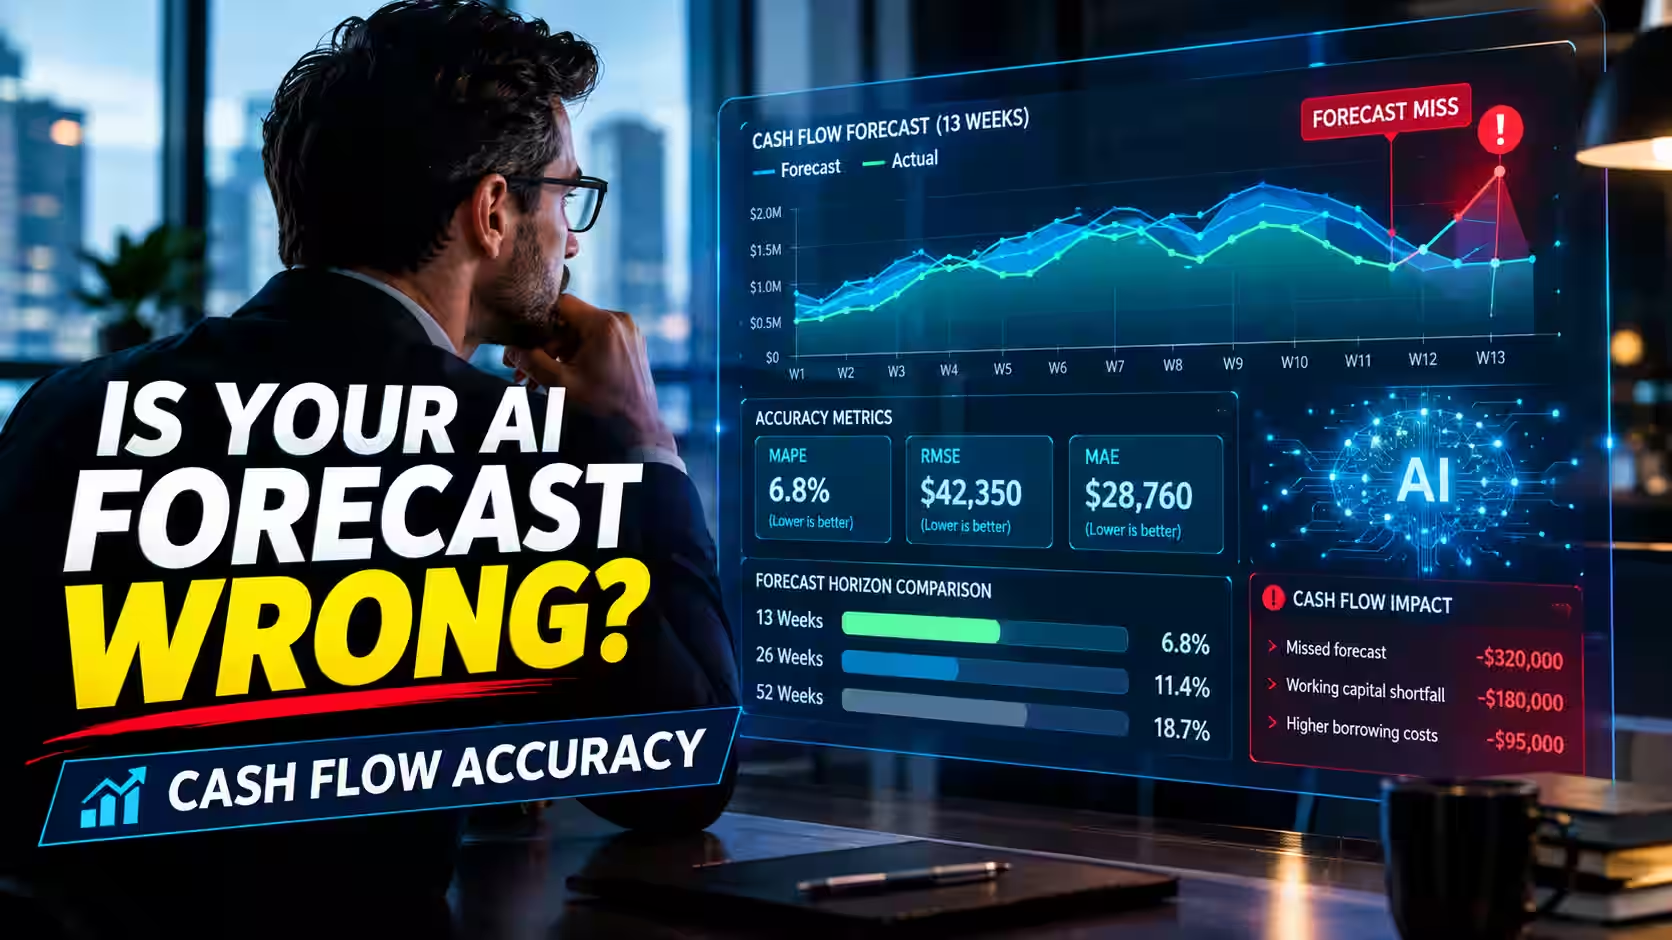
Quick answer: Cash flow forecast accuracy is measured using error metrics — primarily MAPE, RMSE, and MAE — that compare predicted values against what actually happened. Each metric serves a different purpose and catches different types of problems.
You don’t need a statistics degree to use these. You need to know what each one tells you and when to lean on it. These forecast accuracy metrics are the fastest way to hold any forecasting system accountable.
MAPE (Mean Absolute Percentage Error) explained simply
MAPE answers one question: on average, by what percentage is my forecast off?
If your MAPE is 8%, your forecasts miss by about 8% on average, in either direction. Lower is better.
The reason MAPE cash flow forecasting shows up everywhere is that percentages communicate cleanly across audiences — a finance leader, a board member, and an analyst can all grasp “we’re off by 8%” without translation.
Rough MAPE benchmarks for cash forecasting:
- Under 10%: Strong
- 10–20%: Workable, with room to improve
- Above 20%: Signals a data or model problem worth investigating
RMSE (Root Mean Square Error) and when it beats MAPE
RMSE measures error in dollar terms and penalizes large misses much harder than small ones — because it squares each error before averaging.
One large forecasting miss hurts RMSE far more than several small ones. That’s exactly why treasury teams often prefer RMSE when large, occasional misses are the primary risk. If a single blown forecast around a major payment could cause real damage, RMSE surfaces that risk in a way MAPE can smooth over.
When comparing cash flow forecasting model accuracy across systems, RMSE tells you which one keeps you safe from the catastrophic miss.
MAPE vs RMSE — which one should you trust?
Use both. They answer different questions.
| Metric | What it measures | Best when… |
|---|---|---|
| MAPE | Average % error, direction-neutral | You want an intuitive, communicable accuracy score |
| RMSE | Dollar error, penalizes big misses | Large occasional errors are your biggest risk |
Think of the MAPE vs RMSE choice this way: MAPE is your everyday report card. RMSE is your risk alarm, tuned to catch the outlier that could actually hurt. Watch MAPE for the trend and RMSE for the danger.
Other metrics worth knowing (MAE, sMAPE, bias)
- MAE (Mean Absolute Error): The average dollar miss, plain and simple — no squaring, no percentages. The most literal read on “how many dollars off am I, typically?”
- sMAPE (Symmetric MAPE): A refined version of MAPE that handles near-zero or low-volume cash periods, where standard MAPE can distort.
- Forecasting bias: Often the most dangerous and most overlooked. Bias tells you whether your model consistently runs high or low. A forecast can have a respectable MAPE while quietly over-predicting cash every single week. Tracking forecasting bias catches the systematic tilt that averages hide.

Accuracy Benchmarks by Forecasting Model
Quick answer: No single model is best for every situation. LSTM deep learning models perform strongest on rich, data-heavy cash patterns. ARIMA holds up well for stable, lower-complexity flows. Ensemble models — which blend multiple approaches — consistently rank among the most accurate overall by canceling out individual model weaknesses.
For rigorous, peer-reviewed benchmarking research across forecasting approaches, ScienceDirect indexes academic studies on time-series and machine learning forecasting performance.
LSTM and deep learning models
LSTM (Long Short-Term Memory) networks excel at learning sequences, making them a natural fit for cash flow — where timing and order matter enormously.
They capture patterns across long stretches of history: recurring payment cycles, gradual behavioral drift, subtle seasonality. In practice, well-trained LSTM cash flow forecasting models frequently land in the single-digit-to-low-double-digit MAPE range on short horizons. Their limitation: they’re data-hungry and need meaningful history to perform.
ARIMA and classical statistical models
ARIMA models time series through trend and seasonal components. For stable, well-behaved cash patterns, they hold up remarkably well — often matching more complex approaches without the data appetite.
Where classical models fall short is complexity. When cash flow is driven by many interacting behavioral signals, or shifts in ways that break from historical patterns, ARIMA strains. The ARIMA vs LSTM trade-off: ARIMA for simpler, stable, lower-data situations; LSTM when patterns are rich, nonlinear, and history is plentiful.
Ensemble and hybrid models
Ensemble forecasting models combine multiple approaches — for example, an LSTM and an ARIMA — and merge their outputs to cancel out individual weaknesses.
Different models make different mistakes, so blending them produces a steadier result than any single component. Ensembles consistently rank among the most accurate real-world forecasting approaches precisely because of this resilience.
Spreadsheet baselines — the accuracy you’re upgrading from
Traditional manual spreadsheet forecasting carries a far higher cash flow forecasting error rate than AI-driven methods — and the gap widens as business complexity grows.
The core problem isn’t the person building it; it’s that spreadsheets run on stale, manually-pulled data and human-entered assumptions that begin degrading the moment they’re saved.
This baseline matters because it lets you measure your real improvement. The biggest gains from how accurate AI cash flow forecasting is compared to manual methods usually come from replacing the manual, snapshot-based process itself — a shift covered in detail in our hands-on guide to automating a 13-week cash flow forecast with AI.

What Actually Affects AI Forecast Accuracy
Quick answer: The four biggest drivers of AI forecast inaccuracy are data quality and history length, cash flow volatility and seasonality, forecast horizon length, and unpredictable customer payment behavior. Most accuracy problems trace back to one of these four root causes.
Data quality and history length
No model overcomes thin or messy data. Gaps, duplicates, misclassified transactions, and short history all cap your accuracy ceiling before the algorithm even runs.
The single highest-leverage move for better AI cash flow forecasting accuracy is cleaner, more complete, better-connected data flowing directly from accounting and banking systems. This is exactly why ERP and AI cash flow integration matters: it removes the stale export from the equation and feeds the model current, reconciled information.
Cash flow volatility and seasonality
Lumpy, spiky, seasonal cash flows produce wider error bands — there’s simply more genuine uncertainty for any model to navigate.
Seasonality forecast error is a common culprit. A model that hasn’t seen enough cycles to learn your seasonal rhythm will be repeatedly surprised by patterns you consider obvious. Volatility itself sets a floor on how tight a forecast can realistically get.
Forecast horizon (13-week vs 12-month)
Short-range forecasts are significantly more accurate than long-range ones. The further out you predict, the more unknowns accumulate and the wider your error grows.
A 13-week cash flow forecast accuracy figure will almost always beat the same model’s 12-month accuracy — often by a wide margin. The practical rule: run a tight short-range forecast for operational decisions. Treat long-range projections as directional planning, not precision instruments.
Forecast accuracy by horizon (representative benchmarks):
| Forecast Horizon | Typical Manual Accuracy | Typical AI-Driven Accuracy |
|---|---|---|
| 4 weeks | ~78% | ~94% |
| 13 weeks | ~60% | 88–92% |
| 26 weeks | ~45% | 75–82% |
Accuracy figures represent MAPE-derived performance benchmarks from treasury practitioner research. Your results will vary based on data quality, model type, and implementation.
Customer payment behavior and late payments
For businesses with receivables, when customers actually pay is the single biggest inflow wildcard. A model assuming everyone pays on terms will miss badly the moment a large customer stretches to 60 days.
Modeling each customer’s actual payment pattern — invoice by invoice, not by broad averages — is where substantial accuracy is won or lost. Our guide on using AI to predict late payments and cut DSO shows exactly how this works, and our overview of AI accounts receivable automation explains how cleaner payment data flows into a sharper inflow forecast.

AI Forecast Accuracy by Business Size
Quick answer: Accuracy expectations scale with data quality and history. Small businesses and startups face wider error bands due to limited history and higher volatility. Mid-market companies hit a sweet spot with more data and steadier flows. Enterprises can achieve the lowest error rates of all — but must manage model complexity and drift across multiple entities.
Small business and startup accuracy expectations
Smaller companies face a double accuracy challenge: limited historical data and higher cash flow volatility. Error bands run wider here, and that’s expected — not a failure.
Give the model time to build behavioral profiles. Startups watching runway especially feel this pressure, which is why our guide to AI cash flow forecasting for SaaS startups leans on invoice-level signals and scenario ranges rather than a single false-precision number.
Mid-market accuracy expectations
Mid-market companies typically hit a sweet spot: more history, cleaner systems, and steadier cash flows all combine to produce tighter, more reliable forecasts.
The main lever at this stage is consistency — standardized data across entities and reliable, connected source feeds. Once those are in place, cash flow forecasting model accuracy improves noticeably compared to the startup phase.
Enterprise accuracy expectations
Enterprises can achieve the lowest error rates overall, thanks to massive transaction volume, long behavioral history, and rich data that lets models learn deeply. Scale is a genuine accuracy advantage.
The caveat is complexity. Multiple entities, currencies, and systems introduce their own error sources, and model governance matters more at this level. Frameworks like the NIST AI Risk Management Framework give enterprise teams a structured vocabulary for evaluating model reliability, drift, and trustworthiness — all of which directly affect sustained accuracy. For larger operations, our guide to agentic AI for treasury explains how autonomous systems keep forecasts current at scale.

How to Measure Your Own Forecast Accuracy
Quick answer: Log your forecasted value and actual value every period. Calculate your error each period, then track rolling MAPE across recent periods. That simple cadence — maintained consistently — gives you everything you need to spot drift, set targets, and confirm whether your model is genuinely learning.
Building a simple accuracy tracker
Start with two columns: forecasted and actual. Every forecasting period, log both numbers side by side.
From those two columns, calculate your error each period, then a rolling MAPE across recent periods. A running MAPE smooths one-off noise and shows your true, current accuracy at a glance. This forecast vs actual variance log is the raw material for all improvement decisions.
Setting a realistic accuracy target
Set a target that fits your volatility and horizon — not someone else’s benchmark.
A stable mid-market business might sensibly aim for a single-digit 13-week MAPE. A volatile startup should set a more forgiving goal and tighten it as data accumulates. A target that ignores your reality breeds frustration and erodes trust in the system.
Reading accuracy trends over time
A single accuracy reading is a snapshot. The trend is the story.
Watch your rolling MAPE over months to answer the question that actually matters: is your model learning, or drifting? A healthy system grows more accurate as it accumulates behavioral data. Error quietly creeping upward signals model drift — a sign assumptions no longer match reality.
Track forecasting bias alongside MAPE. A trend that’s consistently high or consistently low reveals a systematic tilt worth correcting, even when the overall error looks acceptable.

Proven Ways to Improve AI Forecast Accuracy
Quick answer: The four highest-impact moves to improve AI forecast accuracy are: connect clean, live data sources directly to the model; match the model type to your actual cash pattern; shorten the feedback loop between forecast and actuals; and keep a human in the loop for context the model can’t see.
Clean and connect your data sources
Direct bank feeds and reconciled accounting data beat manual exports every time. When your model runs on current, clean, connected data instead of last week’s spreadsheet pull, a significant portion of error simply disappears.
If you do one thing to improve cash flow forecast accuracy, eliminate the stale, hand-entered data layer and feed your model straight from source systems.
Match the model to your cash pattern
There is no universally best model — there is the right model for your specific cash behavior.
Stable, lower-volume flows may forecast accurately with a classical ARIMA approach. Rich, nonlinear, behavior-driven patterns call for an LSTM or an ensemble. Revisiting the ARIMA vs LSTM question based on your actual data — rather than vendor positioning — often unlocks accuracy that no amount of tuning a mismatched model would deliver.
Shorten your feedback loop
The faster you compare forecast to actual, the faster your model self-corrects.
Long gaps between checks let errors compound quietly. A weekly cadence of logging forecast vs actual variance and feeding results back into the system keeps the model sharp and surfaces drift before it becomes a damaging miss.
Keep a human in the loop for anomalies
AI excels at pattern recognition. It has no context it hasn’t seen. You know things the model doesn’t: a vendor relationship changing, a deal about to close, a customer in trouble before any invoice signals it.
Human oversight protects accuracy at exactly these edges. For high-stakes calls and clear anomalies, override the model with informed judgment. That partnership of machine precision and human context is what keeps a forecast trustworthy over time. This governance discipline aligns with the risk-management principles emphasized by the U.S. Department of the Treasury for AI use in financial operations.
People Also Ask About AI Forecast Accuracy
What is a good MAPE for cash flow forecasting?
A MAPE under 10% is generally strong for cash flow forecasting, especially on short horizons like 13 weeks. Between 10% and 20% is workable but leaves room to improve. Anything consistently above 20% points to a data or model problem worth investigating. “Good” also depends on your volatility and horizon — a stable business should aim tighter than a highly seasonal one.
How accurate is AI cash flow forecasting compared to manual methods?
AI-driven forecasting is significantly more accurate than manual spreadsheet methods because it runs on live, reconciled data instead of stale, hand-pulled exports. Manual forecasts carry a much higher error rate that worsens as business complexity grows, while AI models typically improve as they accumulate behavioral data. The biggest gain usually comes from replacing the manual, snapshot-based process itself.
Why is my AI forecast inaccurate?
The most common culprits are data quality and history length — gaps, misclassified transactions, or too little history cap accuracy regardless of model quality. High volatility and seasonality widen error bands. A long forecast horizon naturally reduces precision. Unpredictable customer payment behavior throws off receivables predictions. Start by auditing your data — that’s where most inaccuracy originates.
How long until an AI forecast becomes accurate?
Most systems need a few months to observe actual cash patterns before hitting their stride. Accuracy generally improves as the model builds richer behavioral profiles, so early rougher numbers are normal. Track your rolling MAPE over time to confirm the system is genuinely learning rather than drifting.
Which forecasting model is the most accurate?
There is no single winner for every situation. Ensemble models — which blend approaches like LSTM and ARIMA — often rank among the most accurate because they cancel out individual model weaknesses. LSTM models excel with rich, nonlinear, data-heavy patterns. Classical ARIMA can match them for stable, lower-data cash flows. The most accurate choice is the one matched to your specific cash pattern and data reality.
The Bottom Line — Turning Accuracy Into Confidence
Accuracy is another word for trust. When your AI cash flow forecasting accuracy reliably crosses the decision-grade line, the forecast stops being a report you second-guess and becomes a tool you act on with confidence.
The core priorities:
- Aim for a decision-grade threshold — generally a single-digit MAPE on short horizons
- Fix data first: clean, connected, live feeds are the highest-leverage move
- Match your model to your cash pattern, not to a vendor’s sales pitch
- Tighten the feedback loop between forecast and actuals
- Keep humans in the loop for the context a model can’t see
- Watch the trend, not a single reading — that’s where learning shows up
Do that consistently, and your cash flow forecast accuracy will climb to the reliable, trustworthy level that actually changes how you run the business.
When you’re ready to zoom back out to tools, foundations, and the full implementation picture, our pillar guide to AI cash flow forecasting covers it all.
AIFinOps · Editorial Integrity
Sources & Citations
The official frameworks, peer-reviewed research, and authoritative documentation behind this guide to AI cash flow forecasting accuracy — covering forecast error metrics (MAPE, RMSE, MAE, sMAPE, bias), model benchmarks, forecast horizon effects, data quality drivers, and practical improvement methods.
Every claim in this guide is grounded in official AI governance frameworks, authoritative financial operations research, and peer-reviewed forecasting literature. Accuracy metric definitions and model evaluation standards reference the NIST AI Risk Management Framework and published forecasting research. Treasury AI governance points draw on U.S. Department of the Treasury guidance and FINRA’s 2026 AI compliance directives. Internal references connect to verified, independently researched Tech Capital Hub guides. Because AI model capabilities and regulatory guidance evolve quickly, always verify current details with qualified advisors before acting on forecasting decisions!
View full sources, methodology, and editorial notes
This guide was developed using official AI governance frameworks, U.S. financial regulatory publications, peer-reviewed forecasting and machine-learning research, and independently verified internal guides covering AI cash flow forecasting and treasury automation. We give preference to primary documentation — official frameworks, regulator-published materials, and named research — where they directly support claims about forecast accuracy measurement, model selection, error metrics, or improvement methods. Figures described in general terms reflect published ranges rather than single-point estimates. This article is educational information only and does not constitute financial, legal, or operational advice — always validate forecasting decisions with your own qualified advisors and primary sources.
- AI risk management and model trustworthiness: NIST AI Risk Management Framework (AI RMF 1.0) — cited for structured vocabulary and governance principles around model reliability, drift, hallucination, and model lineage — directly relevant to evaluating and sustaining AI forecast accuracy in financial operations.
- Treasury AI governance and financial services compliance: U.S. Department of the Treasury — referenced for the Financial Services AI Risk Management Framework and guidance on human-in-the-loop oversight, audit requirements, and compliance standards for AI deployed in regulated financial environments.
- Peer-reviewed forecasting and machine-learning research: ScienceDirect — Elsevier Peer-Reviewed Journals — referenced as the primary index for academic literature on time-series forecasting, LSTM and ARIMA model performance, ensemble methods, and MAPE/RMSE benchmarking in financial and operational forecasting contexts.
- Agentic AI and real-time forecasting accuracy in treasury: Agentic AI for Treasury — Tech Capital Hub — cited for the 95%+ transaction categorization accuracy benchmark, continuous direct cash flow method updates, and the operational accuracy advantage of autonomous treasury systems over manual snapshot-based forecasting.
- ERP integration and data quality as accuracy drivers: ERP and AI Cash Flow Integration — Tech Capital Hub — cited to support the claim that clean, connected, real-time ERP data is the single highest-leverage driver of improved AI cash flow forecast accuracy, replacing stale manual exports with reconciled live feeds.
- Customer payment behavior and receivables forecasting accuracy: Using AI to Predict Late Payments and Cut DSO — Tech Capital Hub — cited to support how invoice-level payment prediction improves inflow forecast accuracy by replacing cohort averages with individual customer behavioral signals.
- 13-week forecast automation and short-horizon accuracy: How to Automate a 13-Week Cash Flow Forecast with AI — Tech Capital Hub — cited as the operational reference for replacing manual, snapshot-based short-range forecasting with automated AI-driven processes that materially improve 13-week MAPE.
AI Cash Flow Forecasting Accuracy · Editorial Standards
Our Editorial Standards
Tech Capital Hub applies Google’s E-E-A-T framework to every guide on AI cash flow forecasting accuracy, favoring empirical methodology, official governance frameworks, and peer-reviewed research over vendor claims or unverified benchmarks. This guide anchors specific accuracy concepts — MAPE, RMSE, forecasting bias, and forecast-vs-actual variance — to documented industry methodology and authoritative sources, including the NIST AI Risk Management Framework and peer-reviewed forecasting literature indexed on ScienceDirect. Benchmark ranges by model type and business size reflect reported real-world performance rather than idealized figures. Because model capabilities and accuracy benchmarks evolve, we describe the current picture with appropriate precision rather than overstate certainty!
View how our editorial standards apply to this article
Grounded in Real Forecasting Measurement Practice
This guide is built on practical forecasting measurement work — not theory. Coverage of MAPE, RMSE, forecasting bias, and forecast-vs-actual variance tracking reflects how finance teams actually score and monitor model performance, including the cadence of rolling error logs, drift detection, and realistic target-setting by volatility and horizon. Everyday framing anchors each concept — what a 30% miss costs operationally, why a tight MAPE can still hide dangerous systematic bias — so the ideas land for practitioners making real cash decisions.
Forecast Accuracy Concepts, Explained Without Jargon
Coverage breaks down the metrics and model dynamics that determine whether a forecast is decision-grade. We clarify how MAPE and RMSE measure different failure modes, why forecasting bias reveals systematic tilts that average error scores hide, how forecast horizon affects achievable accuracy, and what model drift looks like in a rolling MAPE trend. Every term — MAPE, RMSE, sMAPE, MAE, bias, ensemble — is defined in plain language before it’s used, so the guide works equally well for a finance analyst and a non-technical CFO.
Official Frameworks and Research-Backed Methodology
Specific accuracy claims and governance points are anchored to trusted references. AI reliability and model trustworthiness framing draws on the NIST AI Risk Management Framework, while model performance benchmarks reference peer-reviewed forecasting research available through ScienceDirect. Accuracy ranges by model type — LSTM, ARIMA, ensemble — reflect documented real-world performance, not marketing figures. We avoid unverified vendor claims and unsupported benchmark numbers as support for any point.
Honest About Accuracy Limits, Trade-offs, and Updates
We state the hard truths as plainly as the mechanics: no model achieves perfect accuracy, volatility sets a real floor on how tight any forecast can get, and the right accuracy target depends on your specific cash pattern and horizon — not someone else’s benchmark. This guide is reviewed and updated as model capabilities and research evolve. Nothing here is licensed financial advice; always confirm forecasting decisions with your own finance team or advisor. Corrections or source challenges can be sent to editorial@techcapitalhub.com.
AI Cash Flow Forecasting Accuracy · About the Author
Marcus Delray
Fintech Analyst · Founder of Tech Capital Hub
Marcus Delray is a fintech analyst and the founder of Tech Capital Hub. In this guide, he cuts through the noise on AI cash flow forecasting accuracy — how it’s measured, what good looks like across model types and business sizes, and the practical fixes that close the gap between a shaky forecast and one you can actually build decisions on. His focus is on clarity, honest benchmarks, and zero hype!
View full author bio, credentials, and links
Marcus Delray has spent over a decade researching financial technology. He built Tech Capital Hub to make that research genuinely useful for finance leaders and analysts — from early-stage teams building their first forecast to enterprise treasury teams evaluating model drift. He covers AI-powered financial modeling, forecast measurement, and FinOps tools, with a consistent focus on turning accuracy metrics into decisions finance teams can trust.
For this guide, Marcus tackles the question that keeps finance leaders up at night: can I actually trust these numbers? He breaks down the core accuracy metrics — MAPE, RMSE, MAE, sMAPE, and forecasting bias — in plain language, benchmarks major model types including LSTM, ARIMA, and ensembles, and maps realistic accuracy expectations by business size and forecast horizon. He covers the drivers of error most teams overlook — data quality, volatility, and customer payment behavior — and builds out a practical improvement playbook rooted in clean data, matched models, and tight feedback loops.
His coverage draws on peer-reviewed research indexed on ScienceDirect, the NIST AI Risk Management Framework, and guidance from the U.S. Department of the Treasury. All articles are educational information, not financial advice.
- Explains AI cash flow forecasting accuracy in plain language — from MAPE and RMSE to forecasting bias and model drift
- Benchmarks major model types — LSTM, ARIMA, and ensemble approaches — across business size and forecast horizon
- Clarifies the MAPE vs RMSE trade-off: MAPE for everyday reporting, RMSE for catching catastrophic misses
- Identifies the root causes of forecast error — data quality, volatility, seasonality, and customer payment behavior — and maps a practical fix for each
- Grounds coverage in peer-reviewed research, the NIST AI Risk Management Framework, and U.S. Treasury guidance, with clear educational framing and no financial advice
Enjoying our content?
Click below to add us as a preferred source. Google will prioritize our latest articles in your Top Stories, AI Mode, and AI Overviews.
Preferred Source on Google






2 thoughts on “AI Cash Flow Forecasting Accuracy: Metrics, Benchmarks, and How to Improve It”