ERP AI Cash Flow Integration Problems: 3 Fixes for NetSuite, Sage Intacct, and QuickBooks


Fintech Analyst · Founder of Tech Capital Hub
Marcus has spent more than a decade researching AI-powered finance systems, ERP workflows, and cash flow forecasting operations. In this guide, he explains how ERP AI cash flow integration problems actually happen after go-live, from sync timing gaps and unmapped custom fields to intercompany double counting, inconsistent categories, and post-implementation variance tracking across NetSuite, Sage Intacct, and QuickBooks Online.
The demo looked great. It had clean charts, a live cash view, and a confidence band around every week. The finance director watching it leaned back and said, “This is exactly what we’ve been asking for.”
Six weeks after go-live, his weekly forecast was off by $400,000.
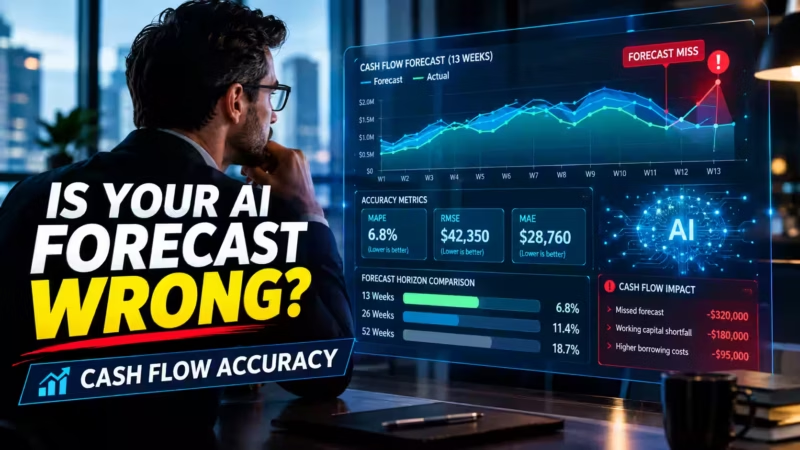
The AI wasn’t broken, and nobody had made a setup mistake. The data pipeline between his Oracle NetSuite instance and the forecasting tool had a 36-hour timing gap that nobody had documented. The model was forecasting confidently on stale numbers.
He called me that afternoon, more puzzled than angry. “The tool works. The numbers are just wrong.”
I’ve heard that sentence more times than I’d like. In my experience, ERP AI cash flow integration rarely fails at the algorithm. It fails in the pipe.
Short answer: When an AI cash forecast goes wrong after ERP integration, the cause is usually the data pipeline, not the model. The most common failures are stale syncs, unmapped fields, inconsistent account categories, and intercompany transactions counted twice. You fix the pipeline by mapping data before ingestion, consolidating inside the ERP, and logging every variance for 90 days.
This guide is specifically for fixing a broken ERP-to-forecasting connection after implementation — not for choosing a forecasting tool or building a cash forecast from scratch.
This guide is for you if:
- Your forecast doesn’t match the bank balance after connecting NetSuite, Sage Intacct, or QuickBooks Online.
- You’re live on a forecasting tool, or within 60 days of go-live, and the numbers don’t add up.
- You’re a controller or finance systems lead who owns the integration.
Still choosing a tool? Start with our AI cash flow forecasting overview. Building your first rolling forecast? See how to automate a 13-week cash flow forecast.
Key Takeaways
- The pipeline fails before the model does. Most bad forecasts after go-live trace back to data timing, mapping, or consolidation — not the algorithm.
- Document your ERP sync timing gap. A forecast built on 36-hour-old data looks correct and is wrong.
- Consolidate in the ERP. If the forecasting tool combines entity feeds on its own, it will double count intercompany activity.
- Each ERP breaks differently. NetSuite tends to break at eliminations, Sage Intacct at currency and close timing, and QuickBooks at category sprawl.
- Test with your ugliest data. Clean samples always pass. Edge cases reveal where the real failures are hiding.
- Run a 90-day variance log. Write a root cause for every variance above your threshold while the implementation team is still engaged.
The 3 Fixes at a Glance
Three fixes solve the majority of ERP AI cash flow integration problems. Each targets a different layer of the pipeline.
- Map and normalize ERP data before it reaches the AI. Match every field to its exact source, and record when each feed refreshes.
- Consolidate inside the ERP, not inside the forecasting tool. Pull post-elimination data so intercompany activity isn’t counted twice.
- Stress-test the pipeline, then log every variance. Test with edge cases before go-live, and trace every large miss to its root cause for 90 days afterward.
The rest of this guide covers how to apply each fix and where each ERP typically breaks.
Table of Contents

Why ERP AI Cash Flow Integrations Break
A native connector moves data. It doesn’t translate it. Your forecasting tool sees an API-delivered version of your books — which may differ significantly from what your controller sees in the general ledger.
Think about what travels through that connection:
- Categories that three different people named differently over four years.
- Intercompany charges that appear as revenue in one entity and as a cost in another.
- Custom fields from an old implementation that don’t map to the tool’s standard chart of accounts.
- Subsidiaries whose close schedules don’t line up with each other.
None of this is unusual. Every mid-market company has some version of it. The problem is that the forecasting tool can’t tell any of it is wrong. It treats every input as valid and forecasts with confidence on whatever arrives.
When the numbers drift and your AI cash forecast is wrong after ERP integration, don’t start with the algorithm. Start with the pipe.
Symptom-to-Cause Diagnostic Table
Use this table first. Match your symptom to the most likely cause and the fastest place to check.
Symptom-to-Cause Diagnostic Table
Use this premium troubleshooting matrix to quickly trace forecast issues back to the most likely ERP integration failure point.

Fix 1: Map and Normalize ERP Data Before AI Ingestion
The single highest-leverage move before go-live is building a complete, documented data map. This fix stops most silent errors before they reach the forecasting model.
Build a Field-Level Data Map
List every field the forecasting tool needs. Match each one to its exact ERP source. Flag custom fields by name. Flag any calculated fields that don’t yet exist.
Don’t treat this as something to sort out during implementation. I’ve watched two projects slip six weeks because teams skipped it. The field map is how you confirm that what you think is flowing through the connector actually is.
Document Sync Timing and Lag
Record when each feed runs, what it pulls, and how old the data is when it lands. The $400,000 miss came from a 36-hour ERP sync timing gap that nobody had written down.
There is no universally correct sync frequency. Match the cadence to how often your team acts on the forecast, and then document the lag explicitly so everyone understands how fresh the numbers are. Oracle NetSuite’s SuiteTalk REST web services documentation details how records are exposed through the API, which helps you confirm what each pull actually returns and when.
Example field map (illustrative timings only, not benchmarks):
Example Field Map
Use this reference layout to document where each forecast input comes from, how often it refreshes, how stale it can get, and who owns the feed.
Normalize Accounts and Categories
Merge duplicate categories. Set naming standards. Give every transaction type one home in the chart of accounts. Clean, consistent account data also reduces noise in downstream AR analysis — see our guide on predicting late payments with AI for how this connects. The QuickBooks section below covers detailed cleanup steps.
Fix 2: Consolidate in the ERP, Not the Forecasting Tool
Intercompany double counting is the most common reason consolidated cash forecasts look stronger than reality. The fix is straightforward — but most teams don’t apply it until after the damage is done.
Here’s the mechanics. Entity A sells to Entity B. Inside the ERP, the elimination entry removes that transaction at the consolidated level. If the forecasting tool pulls each entity’s feed and adds them together on its own, both sides of that transaction appear as real activity. Revenue inflates. So does the forecast.
The consolidation principle underlying eliminations is described in accounting standards guidance from the Financial Accounting Standards Board. Your ERP already applies it. Your forecasting tool almost certainly doesn’t.
The rule: Pull consolidated, post-elimination data from the ERP. If that’s not possible, replicate the elimination rules inside the integration layer. It takes more setup, but it isn’t optional. I’ve seen this problem at three companies. Each caught it eventually. One took four months.
Wrong Way vs. Right Way
Use this comparison table to keep multi-entity forecasting clean. The wrong setup inflates forecast confidence. The right setup preserves elimination logic and consolidation accuracy.
When You Also Need Entity-Level Data
Use consolidated data for the top-line forecast. Use entity-level data only for entity-specific views. Tag every intercompany transaction explicitly so it can be filtered out of consolidated outputs cleanly.

Fix 3: Stress-Test the Pipeline and Log Every Variance
Clean test data passes every time. It tells you very little. Real integration failures come from the edge cases nobody included in the test set. Test those before go-live, then track every variance afterward.
Build an Edge-Case Test Set
Build a test dataset that is deliberately awkward. Include:
- Partial-period accruals
- Manual journal entries posted directly to the GL
- Intercompany loans sitting in unusual accounts
- Multi-currency transactions
- Reversals and voided transactions
- Entries posted after the sync window closes
If this set passes cleanly, you’re in good shape. If it doesn’t, you’ve found the problem before your finance director calls you on a Thursday morning.
Run a 90-Day Variance Log
Every week for the first three months, compare the forecast output to the actual bank position. Set a variance threshold that fits your scale — $25,000, $50,000, $100,000, whatever makes sense. Every variance above the threshold gets a written root cause.
Most root causes trace back to the data layer. Finding them while the implementation team is still engaged is relatively cheap. Finding them six months later, under pressure, costs significantly more. Maintaining this kind of documentation discipline also aligns with the monitoring practices described in the NIST AI Risk Management Framework, which is worth knowing if your organization has AI governance requirements.
Variance log template:
Variance Log Template
Use this weekly log to compare forecasted cash against actual bank position, flag material misses, assign ownership, and track fixes before errors compound.
This log validates the integration. If you want formal accuracy measurement once the integration is stable, our guide to measuring forecast accuracy after go-live covers that ground separately.
NetSuite AI Forecasting Integration Fixes
NetSuite integrations most commonly fail at intercompany eliminations, custom field exposure, or period-end close timing. Here’s how to address each.
Multi-Subsidiary Eliminations (OneWorld)
NetSuite OneWorld manages intercompany eliminations natively at the consolidated level. The failure happens when the integration pulls subsidiary feeds separately and lets the forecasting tool combine them. Apply Fix 2 directly: pull consolidated, post-elimination results rather than separate entity feeds. Confirm the connector is calling the correct consolidated report, not the subsidiary-level export.
Custom Fields and Saved Searches
Custom fields built into your NetSuite implementation often don’t appear in standard connector outputs unless you expose them explicitly. Use saved searches or SuiteTalk REST queries to define exactly what the forecasting tool receives. Then verify each output against your field map.
Period-End Close Data
Gaps in the close process flow directly into the forecast. If a subsidiary closes late, the forecasting tool is working from incomplete actuals for that entity. Align your sync schedule to the close calendar for each subsidiary so the model never forecasts from a half-closed period.

Sage Intacct Forecasting Integration Fixes
Sage Intacct integrations most commonly fail at dimension mapping, currency translation timing, or close calendar misalignment. These gaps usually surface after go-live, not before.
Map Dimensions, Not Just Account Codes
Sage Intacct uses dimensions to tag every transaction by department, location, project, grant, or fund. If the integration maps only account codes, those tags never reach the forecasting tool, and the model produces a single flat view with no business-unit detail.
Build the integration around dimensions from the start. Sage Intacct’s product documentation explains how dimensions are structured and how they relate to reporting. When dimensions flow through correctly, the forecast can answer a specific question like: “What does cash look like for the Pacific Northwest region in Q3, excluding capital project spend?” That’s a genuinely useful answer. An account-code-only view isn’t.
International Entities and Currency Translation Timing
When US entities run alongside European or Canadian entities, FX timing and misaligned close schedules regularly create forecasting gaps. Different entities may use different rate sources or different posting dates for currency translation. Confirm which rate source each entity uses and whether close dates align before the integration goes live.
Pre-Go-Live Reconciliation Check
Before any data reaches the forecasting tool, compare Sage’s consolidated export to a manually prepared snapshot. This one step catches roughly 80 percent of the problems I’ve seen in Sage integrations before they reach production.

QuickBooks Online Forecasting Integration Fixes
QuickBooks Online is technically simpler than NetSuite or Sage Intacct. Its data quality problems are often worse — and harder to spot — precisely because the interface makes everything look tidy even when the underlying categories are inconsistent.
Category Sprawl Across Users
One employee codes supplies to “Office Expenses.” Another uses “General Overhead.” A third creates “Ops — Admin” for two months and then stops. The totals still balance, so nobody flags it.
The forecasting model learns patterns. Inconsistent category labels teach it inconsistency. The result is a forecast that swings week to week without a clear reason.
Intuit Assist vs. a Third-Party Forecasting Add-On
Intuit Assist, QuickBooks’ built-in AI tool, helps with categorization suggestions and anomaly detection inside the platform. That’s useful. But if you connect a separate forecasting tool — Jirav, Mosaic, or Cube, for example — Intuit Assist’s work doesn’t substitute for pre-integration data cleanup. Intuit’s QuickBooks support center has detailed guidance on chart of accounts management, including how to merge duplicate accounts and set category standards.
Chart of Accounts Cleanup Before Go-Live
- Merge duplicate categories.
- Set naming standards that every user will follow.
- Give every transaction type exactly one home.
This cleanup takes a few days. Skipping it costs months of noisy, unreliable forecasts.
Before you connect: Confirm you’re on the right edition with our QuickBooks Online vs Desktop comparison. If you’re still running on spreadsheets, see our guide to switching from Excel to QuickBooks before connecting a forecasting add-on.
ERP Integration Fixes Compared
Each ERP has one dominant failure pattern. Use this table as a quick reference before you start digging.
ERP Integration Fixes Compared
Use this snapshot to see where each ERP most commonly breaks, what fix matters most, and what to verify before go-live.
ERP AI Cash Flow Integration Checklist
Work through this in order. Pre-go-live items first, then the 90-day post-launch steps.
Pre-go-live
- Field map completed and signed off by the finance systems lead
- Sync timing and lag documented for every feed
- Consolidation source decided — ERP or integration layer
- Elimination logic tested with real intercompany activity
- Custom fields exposed to the connector
- Chart of accounts cleaned and naming standards set
- Edge-case test set built and passed
- Rollback plan defined
First 90 days after go-live
- Variance threshold set
- Variance log owner named
- Weekly forecast vs. bank comparison scheduled
- Root cause written for every variance above the threshold
- Fixes logged while the implementation team is still engaged
Who Should Own ERP Integration Troubleshooting
Variance questions sit between accounting and technology. IT can’t answer them alone, and neither can accounting.
Some firms describe the people who fill this gap as “Digital Seniors” — professionals with real accounting knowledge and enough technical fluency to trace a data pipeline. As finance teams adopt more automation, and as agentic AI reshapes treasury workflows, this hybrid capability matters more each year.
The finance director in the opening story found his by accident. A staff accountant had read the integration documentation on her own over a weekend. She found the ERP sync timing gap in two hours and fixed it in one afternoon. No consultant. No escalation. Just someone who understood both sides of the pipe.
ERP Integration Troubleshooting FAQs
Why is my AI cash forecast wrong after connecting NetSuite?
The most likely causes are an undocumented ERP sync timing gap, unmapped custom fields, or missing intercompany eliminations. Start with the connector schedule and compare it to when transactions post in NetSuite. Then confirm you’re pulling consolidated, post-elimination data rather than raw subsidiary feeds.
How do I stop intercompany transactions from double counting in a forecast?
Pull consolidated, post-elimination data directly from the ERP. If that isn’t possible with your current setup, replicate the elimination rules inside the integration layer. Tag every intercompany transaction so it can be filtered out of consolidated views.
Should the ERP or the forecasting tool handle multi-entity consolidation?
The ERP should always handle it. It already holds your elimination logic and close controls. Letting the forecasting tool consolidate separate entity feeds is the most common cause of inflated consolidated cash in AI forecasts.
How often should my ERP sync with a forecasting tool?
Match the sync cadence to how often your team acts on the forecast output. Whatever frequency you choose, document the lag for every feed explicitly. The number in the model is only as current as the last successful sync.
What should I clean up in QuickBooks Online before connecting a forecasting add-on?
Merge duplicate categories, set naming standards that every user will follow, and give every transaction type exactly one home in the chart of accounts. Check that those categories have stayed consistent across the last 12 months.
How do I test an ERP integration before go-live?
Build an edge-case test dataset. Include partial-period accruals, manual GL journal entries, intercompany loans in unusual accounts, multi-currency transactions, reversals, and entries posted after the sync window. Clean sample transactions always pass — they tell you almost nothing useful.
Will a forecasting tool fix messy ERP data on its own?
No. It scales whatever it receives — including the mess. Fix the data before connecting the tool, not after.
How do I audit ERP data before connecting a forecasting tool?
Pull 12 months of transaction history. Check for category consistency, intercompany transaction tagging, and month-end close gaps by entity. Run a manual reconciliation between the ERP export and your bank statements for the most recent quarter. Any gaps you find now are cheaper to fix than gaps you find three months into production.
Back to the $400,000 Forecast
The demo still looked great. What changed was the foundation underneath it.
Once the pipeline was clean — correct field mappings, consistent categories, consolidated pulls with eliminations applied — the forecast stayed within 2% of the actual weekly bank position for four straight months.
Your next step is practical. Run the diagnostic table against your current symptoms. Build your field map. Start the variance log this week.
The AI is the easy part. The integration is the project.
ERP AI Cash Flow Integration · Editorial Integrity
Sources & Citations
Official ERP documentation, accounting references, and implementation guidance behind this guide to ERP AI cash flow integration. It covers sync timing gaps, field mapping, intercompany eliminations, category consistency, variance tracking, and post-go-live troubleshooting.
Every key claim in this guide is grounded in official ERP platform documentation, accounting references, implementation guidance, and finance operations best practices. Product-specific examples for NetSuite, Sage Intacct, and QuickBooks Online are used to explain how sync delays, custom field gaps, intercompany duplication, and category inconsistency can distort AI-assisted cash flow forecasting after go-live. Because ERP configurations, integrations, field structures, close workflows, and reporting logic vary by company, always validate mappings, consolidations, and timing assumptions inside your own environment before making operational decisions.
View full sources, methodology, and editorial notes
This guide was written using primary documentation and official product resources wherever possible. We prioritized ERP vendor documentation, accounting platform help centers, finance operations references, and implementation-oriented technical material that explains how data syncs, custom fields, close timing, and consolidation logic work in practice. Examples in the article are illustrative and intended to show common failure patterns, not prescribe a one-size-fits-all implementation path. Actual field names, connector behavior, update frequency, elimination workflows, and reporting outputs vary by ERP instance, data model, and integration architecture. This article is educational information, not financial, accounting, software, or implementation advice.
- NetSuite financial reporting, saved searches, and customization: Oracle NetSuite Documentation — cited for general reference on reporting structures, customization, saved searches, records, and workflows that affect how finance data is surfaced and mapped into downstream forecasting tools.
- Sage Intacct product and accounting workflow guidance: Sage Intacct — cited as an official product reference for cloud financial management workflows, entity structures, and reporting context relevant to forecasting and close processes.
- QuickBooks Online help and product guidance: Intuit QuickBooks — cited as an official reference for product structure, bookkeeping workflows, category management context, and reporting behavior relevant to SMB cash flow forecasting setups.
- AI risk and governance context: NIST AI Risk Management Framework — cited for general AI governance principles relevant to monitoring model outputs, validating inputs, and documenting risks when AI is layered on operational finance data.
- Internal control and financial reporting context: AICPA & CIMA — cited as a professional accounting reference for control-minded thinking around reconciliations, reporting quality, and process discipline.
- Finance systems and automation context: Gartner Finance — cited as a general reference for finance transformation, systems modernization, and automation themes surrounding ERP-connected forecasting workflows.
ERP AI Cash Flow Integration · Editorial Standards
Our Editorial Standards
Tech Capital Hub applies Google’s E-E-A-T framework to every finance technology guide we publish. We favor plain-English explanations, official product documentation, accounting references, and implementation-aware examples over hype or unsupported claims. In this article, ERP integration issues are explained through practical post-go-live failure patterns such as sync timing gaps, intercompany double counting, unmapped custom fields, category inconsistency, and weak variance review. Official vendor materials and control-oriented finance references help shape the explanation, but every example is presented as illustrative because ERP setups, connectors, reporting structures, and AI workflows vary widely from one company to another.
View how our editorial standards apply to this article
Built Around Real Post-Go-Live Failure Patterns
This article is structured around the kinds of issues finance teams actually notice after launch: the forecast looks polished, but the numbers are off. Instead of abstract software language, the guide starts from symptoms such as delayed balances, duplicate cash, missing custom fields, inconsistent categories, and unexplained variance. Tables, examples, and checklists are used to mirror how operators diagnose problems in a live ERP-connected cash flow workflow.
Finance Ops and ERP Logic Explained Clearly
Coverage focuses on the mechanics that matter most in AI-assisted forecasting: sync timing, field mapping, consolidation logic, chart of accounts discipline, and post-close validation. Rather than treating AI as magic, the article shows that output quality depends on source-system structure and data hygiene. NetSuite, Sage Intacct, and QuickBooks Online are referenced as practical examples so readers can connect the concepts to recognizable ERP environments.
Grounded in Official Documentation and Control-Minded Sources
Specific claims are anchored to official vendor materials, accounting references, and implementation-oriented resources wherever possible. We prefer primary documentation and professional guidance over promotional copy, social posts, or recycled software listicles. Where the article discusses AI risk, controls, and review discipline, it does so through generally accepted governance principles rather than vendor marketing language.
Honest About Limits, Variability, and Operational Risk
We state clearly that an accurate-looking dashboard can still be wrong if the integration logic underneath it is weak. ERP structures, close calendars, eliminations, custom fields, and connector behavior vary by company, so examples in the article are illustrative rather than universal. The guide is educational information, not financial, accounting, software, or implementation advice. Corrections or source challenges can be sent to editorial@techcapitalhub.com.
ERP AI Cash Flow Integration · About the Author
Marcus Delray
Fintech Analyst · Founder of Tech Capital Hub
Marcus Delray is a fintech analyst and the founder of Tech Capital Hub. In this guide, he explains ERP AI cash flow integration in practical terms. He focuses on the issues finance teams actually face after go-live, including sync timing gaps, intercompany double counting, custom field mismatches, inconsistent categories, and the variance checks needed to keep forecast outputs trustworthy.
View full author bio, credentials, and links
Marcus Delray has spent over a decade researching financial technology, AI in finance, business systems, and digital operating models. He built Tech Capital Hub to make complex finance and technology topics easier to understand for operators, founders, and everyday readers. His coverage spans fintech, AI, accounting systems, ERP workflows, and business infrastructure, with a steady focus on turning dense implementation topics into clear, usable guidance.
For this guide, Marcus approaches ERP AI cash flow integration as an operational finance problem rather than a software sales pitch. He shows why a forecasting dashboard can look polished while the underlying numbers remain wrong, and he breaks that disconnect down into the most common post-go-live causes: delayed sync schedules, unmapped custom fields, weak field governance, duplicate intercompany activity, and category sprawl across NetSuite, Sage Intacct, and QuickBooks Online.
He also emphasizes the controls that make AI-assisted forecasting more reliable in practice, including ERP-first consolidation, field mapping discipline, variance logging, and post-close review habits. Instead of treating AI outputs as automatically correct, he frames them as downstream reflections of source-system quality. All articles are educational information, not financial, accounting, software, or implementation advice.
- Explains ERP integration and AI-assisted cash flow forecasting in plain, operator-friendly language
- Breaks down sync timing, field mapping, consolidation, and category structure into practical troubleshooting steps
- Uses recognizable ERP examples, including NetSuite, Sage Intacct, and QuickBooks Online, to make abstract issues concrete
- Highlights operational risks such as double counting, stale balances, custom field gaps, and misleading forecast confidence
- Promotes control-minded habits like reconciliation, variance tracking, and ERP-first logic instead of black-box trust in AI outputs
Enjoying our content?
Click below to add us as a preferred source. Google will prioritize our latest articles in your Top Stories, AI Mode, and AI Overviews.
Preferred Source on Google