Fraud Scoring Models: How a Risk Score Is Built in Milliseconds

Fintech Analyst · Founder of Tech Capital Hub
Marcus covers AI fraud detection, payment risk, and financial technology in plain English for merchants, operators, and curious readers. In this guide, he explains how fraud scoring models evaluate transactions in milliseconds using signals from the transaction, device, identity, behavior, and network around it. He breaks down what a fraud score really means, why different vendors score the same payment differently, how thresholds affect both fraud losses and false declines, and when step-up checks like 3D Secure or manual review make sense. He also shows how to tune score bands using real business costs instead of guesswork.
- Fraud Scoring Models
- AI Fraud Detection
- Transaction Risk Scores
- False Declines
- 3D Secure
- Payment Fraud Prevention
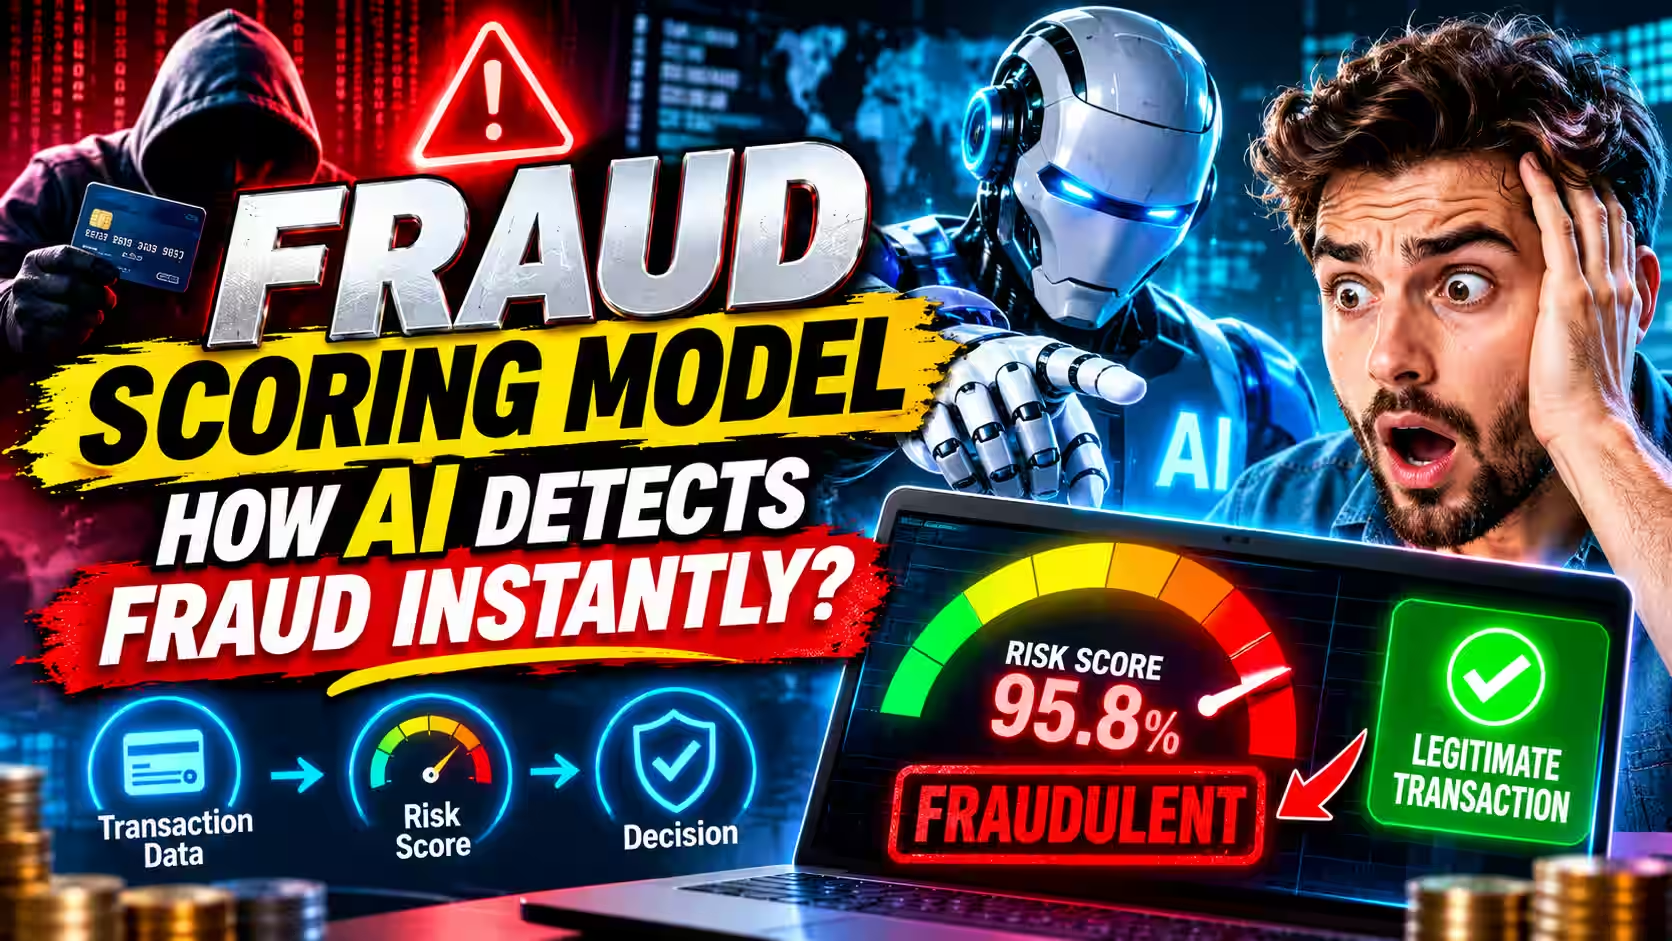
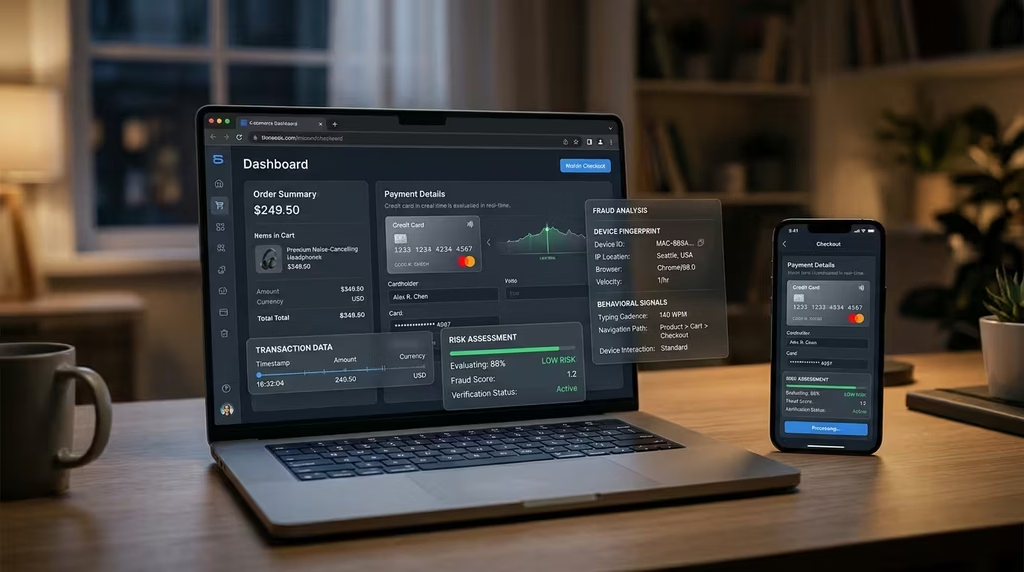
Every card payment you make online gets judged before you see a confirmation screen. In the fraction of a second it takes a payment authorization to clear, a fraud scoring model has evaluated the transaction, the device, the account, and the behavioral patterns around them — then returned a number that represents how risky it looks.
That number decides a lot. It can approve the order instantly, send it to a person for review, trigger an extra verification step, or block it entirely. For merchants, it shapes both fraud losses and revenue from good orders turned away. For shoppers, it explains why a payment sometimes fails for no obvious reason.
This guide is part of TechCapitalHub’s complete resource on AI fraud detection — covering how machines catch what humans miss across every stage of the payment lifecycle. Here, we focus on fraud scoring specifically: how a risk score is built, what it actually means, and how to use it well.
Key takeaways
- A fraud score estimates risk. It doesn’t prove fraud. A high score means a transaction looks like past fraud, not that it is fraud.
- Scores from different vendors aren’t interchangeable. A “75” in one tool can mean something entirely different in another.
- The threshold matters as much as the model. Where you draw the line decides how much fraud you catch and how many good customers you turn away.
- Every setting has two costs. Missed fraud is easy to see on a chargeback report. Blocked good customers are easy to miss — but they cost real money too.
Table of Contents
What Is a Fraud Scoring Model?
A fraud scoring model is a system that estimates how likely a transaction, login, or account action is to be fraudulent. It returns that estimate as a number — often called a fraud risk score or transaction risk score. Businesses then compare the score against preset thresholds and decide whether to approve, review, challenge, or decline.
Put simply, the fraud score meaning is: “how much does this look like fraud we’ve seen before?” The model doesn’t know the truth in the moment. It makes a fast, probabilistic judgment.
Fraud scoring models appear across many contexts:
- Online checkout: scoring card-not-present payments before authorization completes
- Card issuers and banks: scoring purchases before approving them on a cardholder’s account
- Account security: scoring logins, password resets, and changes to payout details
- Onboarding: scoring new account signups and applications for credit or BNPL products
Who scores the transaction? In a card payment, multiple parties may run independent risk assessments. The merchant (or its fraud tool) scores the order before submitting it for authorization. The card issuer runs its own model before approving the charge. Processors and networks may add a third layer. Each sees different data and uses a different model. A score from one party is invisible to the others. That is one reason a payment can pass the merchant’s check and still be declined by the issuing bank — or vice versa.
Most modern scores rely on machine learning, commonly layered with explicit business rules. If you want to understand how those underlying models are built, trained, and evaluated, our guide to machine learning fraud detection covers the algorithms, feature engineering, and performance metrics in depth.
What Goes Into a Fraud Score
A fraud score is only as good as the signals behind it. Models typically combine five broad signal groups. No single signal decides the outcome — the value comes from how they fit together.
Side-by-Side Comparison
What Goes Into a Fraud Score
See how each signal group is evaluated, what data it looks at, and the types of patterns that can raise fraud risk.
| Signal Group |
What It Looks At
Core data points and signals
|
Example of a Risky Pattern
What can trigger concern
Key decision signal
|
|---|---|---|
| Transaction | Purchase and order details Amount, currency, product type, time of day, and shipping method. | High-resale first purchase A first order of high-resale electronics with overnight shipping. |
| Device | Technical device fingerprints Browser and device attributes, IP address, connection type, and emulator signs. | Card velocity from one device One device used with many different cards in an hour. |
| Identity | Customer identity consistency Email age, phone details, name and address consistency, plus AVS and CVV results. | Thin identity with verification mismatch A brand-new email paired with a billing address that fails AVS. |
| Behavior | How the session behaves Typing speed, navigation path, time on page, and copy-and-paste in card fields. | Unnaturally fast checkout A checkout completed far faster than any typical human session. |
| Network | Connections across entities Links between accounts, cards, devices, emails, and addresses. | Shared chargeback-linked destination A shipping address tied to several recent chargebacks across other merchants. |
Bottom line: A strong fraud score comes from many weak signals working together, not from one single red flag on its own.
Velocity runs through all five groups. It measures how often something happens in a short time window — card attempts per device, orders per email address, or failed payments per IP address. Velocity signals are central to spotting card testing attacks, where bots attempt stolen card numbers in rapid bursts to find which ones are still active. Research from LexisNexis Risk Solutions on multi-model scoring illustrates how measuring each transaction against the distinct patterns of different fraud types — rather than collapsing everything into one composite score — sharpens detection across precisely these signal groups.
Behavioral biometrics — such as the way someone holds their phone, moves their mouse, or types their card number — provide an additional layer that is difficult for attackers to replicate at scale. TechCapitalHub’s guide to behavioral biometrics in banking fraud prevention explains how these continuous signals are used in practice.
Two additional points are worth keeping in mind:
- Context changes what a signal means. A billing and shipping mismatch is common for gift orders. On its own, it says very little. Paired with a brand-new email, a high-value cart, and a device linked to other cards, it says much more.
- Some processors see more than you do. Large payment networks and processors compare your transaction against patterns drawn from traffic across many merchants. A single store’s in-house model only sees its own history.
A note on fairness. Device signals, IP geolocation, and identity checks can inadvertently disadvantage customers who use VPNs for privacy, travel frequently, live in high-risk postal areas, or have thin credit files through no fault of their own. Teams building or tuning scoring systems should periodically review whether decline rates and false-positive rates vary materially across demographic or geographic groups — and whether those differences can be explained by genuine risk rather than proxy discrimination.
Mini-takeaway: A strong fraud score comes from many weak signals combined, not one magic indicator.

How Fraud Scores Are Calculated
The math varies by vendor, but the basic path from raw data to a usable score follows a similar pattern across most systems.
From Model Output to Score: Probability, Scaling, and Calibration
Step 1: The model produces a raw output. Many fraud models — gradient-boosted trees, logistic regression, or neural networks — output a value between 0 and 1. In a well-built system, that value approximates the probability that a transaction is fraudulent.
Step 2: The output is scaled. Raw probabilities are hard to read, especially when most of them are very small numbers. Vendors typically convert them to a friendlier scale, such as 0 to 100 or 0 to 999. Some use a straight linear conversion. Others rank transactions relative to each other, so a score of 95 means “riskier than 95% of transactions seen,” not “95% likely to be fraud.”
Step 3: The score is calibrated. Calibration checks whether scores align with observed reality. If a model is well calibrated, then among all transactions assigned a predicted probability of 0.10, roughly 10% should actually turn out to be fraudulent. A poorly calibrated model might rank transactions in broadly the right order but systematically overstate or understate the true risk level. The scikit-learn documentation on probability calibration provides a solid technical foundation for understanding why this step matters and how to test for it.
Calibration matters because fraud is rare. In most payment portfolios, the overwhelming majority of transactions are legitimate. A score signaling a 20% fraud probability is very elevated compared to a typical order — yet four out of every five such orders could still be genuine customers. This is why treating a high score as proof of fraud is almost always wrong.
Why the model needs labels. A model learns from past transactions marked as fraud or not fraud. Those labels often arrive late. A chargeback can take weeks or even months to appear after the original purchase. Until then, the model treats the transaction as unconfirmed. This label delay is one of the primary reasons models drift over time and require regular retraining — a dynamic our guide to machine learning fraud detection covers in depth.
Why Scores Differ Between Vendors and Aren’t Directly Comparable
A merchant switching tools — or running two tools side by side — often wonders why the same order scores 30 in one system and 70 in another. Both systems can be working correctly. Scores differ for four main reasons:
Side-by-Side Comparison
Why Scores Differ Between Vendors and Aren’t Directly Comparable
See the main reasons fraud scores vary across tools and what those differences mean in practice when you compare vendors.
| Reason |
What It Means
How the scoring difference works
|
In Practice
What teams should understand
Critical for threshold setting
|
|---|---|---|
| Different scales | Scores are not measured the same way One tool may use a 0–100 scale, another may use 0–999, and another may show a raw probability or percentile rank. | The same number can mean something very different A score of 75 in one system may not represent the same risk level as 75 in another. |
| Different features | Each vendor sees different data inputs One provider may use proprietary device intelligence, broader network data, or behavioral signals another tool does not collect. | Two vendors may judge the same order from different angles Even when reviewing the same transaction, they may reach different conclusions because the underlying signals are not identical. |
| Different labels | “Fraud” is defined differently across systems Some vendors train on chargebacks only, while others include manual review outcomes, customer reports, or policy abuse. | The target the model learns from is not universal A vendor focused on one fraud definition may score risk differently from a vendor trained on a broader set of bad outcomes. |
| Different calibration | Numerical scores are mapped differently Two models can rank transactions in a similar order but assign very different score values to that same ordering. | Thresholds do not transfer cleanly between vendors A cutoff that worked in one system should be rebuilt from your own data before you use it in another. |
Bottom line: Never assume two fraud scores are interchangeable. Always reset thresholds based on your own transaction history when evaluating a new vendor.
The practical lesson: never carry a threshold from one tool to another. If your previous system blocked orders at a score of 80, that number is meaningless in the new one. Re-set thresholds using your own transaction data, as covered in the tuning section below.

From Score to Action: Approve, Review, or Decline
A score on its own does nothing. Value comes from what you do with it. Most businesses divide scores into bands and attach a specific action to each.
Score Bands and Step-Up Authentication
A typical three-band setup looks like this. The cut-offs below are illustrative, not recommended values.
Side-by-Side Comparison
Score Bands and Step-Up Authentication
See how common fraud score bands map to approval, review, or decline actions — and why each response fits that level of risk.
| Score Band |
Typical Action
What merchants usually do
|
Why
Reasoning behind the response
Illustrative only
|
|---|---|---|
| Low risk | Approve automatically Let the transaction pass with no extra friction and keep the checkout experience fast. | Protect conversion on the safest traffic Most legitimate customers should move through quickly, so low-risk scores are typically approved without interruption. |
| Medium risk | Step-up authentication or manual review Add a checkpoint such as 3D Secure, OTP verification, or a manual analyst review before making a final decision. | Gather more evidence in the gray zone These transactions are not clearly safe or clearly fraudulent, so the goal is to confirm legitimacy without declining too aggressively. |
| High risk | Decline, or hold for manual review on high-value orders Block the transaction outright or route select cases for review when the order value justifies the extra effort. | Reduce likely fraud losses while preserving optional recovery High-risk orders are more likely to create chargebacks or financial loss, so businesses usually prioritize protection over convenience here. |
Bottom line: The middle band is where step-up authentication adds the most value — it helps recover good orders without treating every risky-looking transaction as automatic fraud.
The middle band is where risk-based authentication comes in. Rather than treating every transaction identically, you add friction only when the risk justifies it. Low-risk customers pass straight through. Higher-risk transactions trigger an additional check.
3D Secure is one of the most widely used step-up tools for card-not-present payments. The current protocol — formally known as EMV® 3-D Secure (EMV 3DS) and maintained by EMVCo, the global technical body jointly owned by American Express, Discover, JCB, Mastercard, UnionPay, and Visa — enables the merchant to share transaction, device, and session data with the card issuer. The issuer then runs its own risk model and either:
- Approves without friction (a “frictionless” flow where the shopper notices nothing), or
- Challenges the cardholder — for example with a one-time passcode, biometric prompt, or banking app approval.
When a payment is successfully authenticated through EMV 3DS, fraud-related chargeback liability generally shifts from the merchant to the card issuer, though card network rules include exceptions that merchants should verify directly with their acquirer or the relevant networks. As the U.S. Payments Forum’s March 2026 EMV 3DS resource brief notes, each payment network maintains fraud and chargeback monitoring programs with defined tolerance thresholds — and using EMV 3DS can help merchants stay below those thresholds where financial penalties and loss of chargeback protection may otherwise apply.
In the United States, 3D Secure is optional for most merchants. In Europe and the United Kingdom, Strong Customer Authentication requirements under PSD2 — overseen by the European Banking Authority — make it far more prevalent. A 2020 ResearchGate study investigating 3-D Secure’s fraud-detection model quantified the impact of the specific factors used by 3DS 2.0 in its risk decision-making, which is useful reading for teams evaluating frictionless versus challenge flow strategies.
Other step-up options include one-time passcodes, email or phone confirmation, and prompting a returning customer to re-authenticate. Each adds friction, and some genuine customers will abandon at that step. That is why step-up works best as a targeted tool applied to the gray zone, not a blanket rule for all traffic.
Manual review is the other middle-band option. It can catch fraud that models miss and rescue legitimate orders a model would otherwise block. But it is slow, labor-intensive, and does not scale. Review queues make the most sense for high-value orders where the additional decision time is clearly worth the cost.
How Fast Is Real-Time Fraud Scoring?
“Real-time” fraud scoring means the score is generated and acted on before the payment authorization response is returned to the customer. In practice, this means the scoring decision — including data collection, model inference, and threshold comparison — must typically complete within the latency budget of a card authorization, which is measured in hundreds of milliseconds.
Industry practitioners describe fraud engines evaluating risk across hundreds of signals in well under a second, with latency varying based on vendor architecture, the number of external data sources queried, and whether the scoring runs at the merchant or the issuer side. What matters practically is that customers should not perceive any delay. If your fraud tool is adding visible lag at checkout, that is an integration problem worth diagnosing before it affects conversion.

Threshold Walk-Through: Fraud Caught vs Good Orders Blocked
This is where the real trade-off becomes visible. The table below uses hypothetical numbers for a store processing 100,000 orders, 500 of them fraudulent, at an average order value of $80. The model scores each order from 0 to 100, and the store declines everything at or above the chosen cut-off.
Threshold Walk-Through
Fraud Caught vs. Good Orders Blocked
See how tightening a fraud threshold can catch more bad orders while also increasing false declines and total cost.
| Decline Cut-Off |
Fraud Caught
Of 500 fraudulent orders
| Fraud Missed |
Good Orders Declined
Of 99,500 legitimate orders
|
Estimated Net Cost
Fraud loss + revenue lost
Lowest-cost examples highlighted
|
|---|---|---|---|---|
| 95+ | 150 (30%) Smaller catch rate, but very little legitimate traffic is blocked. | 350 More bad orders still get through at this looser threshold. | 50 Very few legitimate customers are turned away. | $32,000 $28,000 fraud loss + $4,000 revenue lost Illustrates a light-touch strategy with limited false declines. |
| 90+ | 250 (50%) Catches half of fraudulent orders without a major surge in good-order declines. | 250 Missed fraud falls meaningfully versus the 95+ threshold. | 150 More genuine orders are blocked, but still within a relatively controlled range. | $32,000 $20,000 fraud loss + $12,000 revenue lost Shows the same total cost as 95+, but with a different trade-off profile. |
| 80+ | 350 (70%) Significantly stronger fraud capture than the looser thresholds. | 150 Only a smaller share of fraud now slips through. | 600 Legitimate order loss starts rising much faster. | $60,000 $12,000 fraud loss + $48,000 revenue lost This is where false declines begin to outweigh the fraud savings. |
| 70+ | 410 (82%) Strong fraud capture, but with much heavier friction on legitimate traffic. | 90 Missed fraud falls again as the decline line gets tighter. | 1,800 A large number of good customers are now blocked. | $151,200 $7,200 fraud loss + $144,000 revenue lost At this point, protecting against more fraud becomes very expensive commercially. |
| 60+ | 450 (90%) Excellent fraud catch rate, but only by blocking a huge amount of legitimate demand. | 50 Very little fraud now remains uncaught. | 4,500 False declines surge to a damaging level. | $364,000 $4,000 fraud loss + $360,000 revenue lost This shows how aggressively tight thresholds can quietly destroy more value than they save. |
Bottom line: Catching more fraud is not automatically better. The real goal is minimizing total cost, which usually means balancing fraud prevention against lost revenue from good customers who get blocked.
†Simplified at $80 per order. Real fraud losses also include chargeback fees, shipping costs, and operational overhead. Real revenue losses should be adjusted for profit margin, retry success rate, and estimated long-term customer lifetime value.
The net cost column reveals something the fraud-caught column hides: tightening your threshold beyond a certain point costs more in lost revenue than it saves in fraud. In this hypothetical, moving the cut-off from 95 to 90 is cost-neutral. Moving it to 80 or below costs more than it saves.
Three additional lessons stand out:
- Catching the last slice of fraud is expensive. Moving the threshold from 90 to 60 catches 200 more fraudulent orders but blocks 4,350 more legitimate ones.
- False declines grow faster than fraud caught. At the 60 cut-off, the store declines roughly ten good orders for every fraudulent one it stops.
- The right cut-off depends on your specific economics. A store with thin margins and low-value products may absorb more fraud. A store selling high-resale electronics may justify more friction. Neither approach is universally correct.
A middle band often offers the best outcome. Rather than declining everything between 70 and 90, routing those orders to EMV 3DS or manual review can recover a meaningful share of legitimate orders while still applying a checkpoint to the riskiest ones.
For a deeper look at the revenue cost on the right side of this table — including how to measure false declines you can’t directly observe — see our guide to false positives in fraud detection.
What Is a Good Fraud Score?
There is no universal good fraud score. A score only carries meaning relative to its specific scale, its calibration, and your business’s risk tolerance.
Here is why a single number doesn’t work across tools or merchants:
- Scales differ. A 40 on a 0–100 probability scale and a 40 on a percentile rank scale describe very different risk levels.
- Direction can differ. Most tools treat higher scores as riskier, but some trust or reputation scores work in reverse.
- Business context differs. A digital gift card seller and a furniture retailer face completely different fraud dynamics and cost structures — even if they use the same scoring tool.
A better question is: what score range should trigger each action for my business? To answer it, analyze how fraud and chargeback rates vary across score ranges in your own historical data. Orders scoring consistently low almost never result in chargebacks are candidates for automatic approval. A range where fraud rises sharply is a natural decline zone. The band in between is where step-up authentication and manual review earn their cost.
If you use a processor’s built-in scoring tool, consult its documentation carefully on how scores and risk levels are defined and what data feeds the model. Our Stripe Radar review explains how one of the most widely used built-in fraud tools presents risk and where merchants commonly layer custom rules to extend its coverage.

Why a Legitimate Payment Gets Flagged
If your payment was declined or held even though you did nothing wrong, you are far from alone. Fraud scoring models judge statistical patterns, and ordinary customer behavior can closely resemble those patterns.
Common reasons a genuine payment gets flagged:
- You are traveling or shopping from a new location, IP address, or VPN.
- You are using a new device or browser the merchant or issuing bank has not seen before.
- The purchase is unusually large or atypical compared to your normal spending.
- Billing and shipping addresses do not match — very common when sending a gift.
- The billing address entered does not match your bank’s records — often after a move or because of a small typo.
- You retried quickly after an error, which can superficially resemble the velocity pattern of card testing attacks.
- The card is new, leaving little transaction history for the model to draw on.
It also helps to know who declined the payment. A transaction can be stopped by the merchant’s fraud tool or by your own card issuer. Both run independent checks, and the decline message rarely specifies which party made the call. The Consumer Financial Protection Bureau’s guidance on billing disputes is a useful reference for understanding your rights as a cardholder when payments are declined or disputed.
What to do next:
- Do not keep retrying the same card immediately. Repeated failed attempts can further elevate your risk score.
- Confirm that your billing address and ZIP code match your bank’s records exactly.
- Check for a fraud alert from your bank via text, email, or app — and confirm the purchase if it is genuinely yours.
- Call your bank using the number printed on the back of your card, never a number from an unexpected call or message.
- If the bank approved the charge, contact the merchant. They may be able to approve the order through manual review.
- Try an alternative payment method — such as a digital wallet — if the merchant offers one.
One important caution: If you receive a call or text claiming your payment was flagged and asking for codes, passwords, or a transfer of funds, treat it as a likely social engineering attempt. End the call and contact your bank directly through its official channels. The FTC’s guidance on imposter scams explains how these attacks work and what steps to take.
How to Set and Tune Fraud Score Thresholds
Thresholds are not a one-time configuration. Fraud patterns, product mix, and customer behavior change over time, and so do models. Here is a practical ten-step process.
- Define your costs first. Estimate what a fraudulent order truly costs — goods, shipping, chargeback fees, operational time — and what a declined legitimate order costs: lost margin, lost repeat purchases, and support overhead. These two numbers frame every subsequent decision.
- Measure your baseline. Track approval rate, fraud rate, chargeback rate, manual review rate, and decline rate, segmented by score range.
- Account for label delay. Chargebacks arrive weeks after the original transaction. Evaluate thresholds using orders old enough for most fraud to have surfaced, or you will underestimate the fraud rate in recent data.
- Backtest before changing anything. Replay historical transactions against a proposed new threshold and build your own version of the walk-through table above.
- Use shadow mode for new rules or models. Let a proposed change score live traffic without acting on it. Compare what it would have decided against what actually happened.
- Segment where it makes sense. A single threshold rarely fits every product category, geography, or customer type. Returning customers with a strong purchase history often warrant a different cut-off than first-time buyers.
- Measure false declines you can’t directly observe. Some teams approve a small, controlled holdout sample of orders they would normally decline to learn how many were genuinely legitimate. Keep the sample small and cap order values to limit exposure.
- Use step-up instead of decline in the gray zone. Risk-based authentication — applying additional verification only when risk justifies it, as outlined in NIST Special Publication 800-63B on digital identity — often recovers good orders without materially increasing fraud exposure.
- Watch for model drift. If score distributions shift suddenly, investigate. It can signal a new attack pattern, a data pipeline issue, or a meaningful change in your customer mix.
- Document every change. Record what changed, why it changed, and what happened afterward. Good documentation makes future tuning faster and makes it easier to justify decisions to stakeholders or auditors.
When should you review thresholds? At minimum, set a scheduled review every quarter. In addition, review thresholds immediately after any significant spike in fraud or chargebacks, after a major product launch or seasonal peak, after onboarding a new high-volume customer segment, and whenever a new attack pattern is detected. Don’t wait for a fixed calendar date if the signals are already telling you something has shifted.
Common mistakes to avoid:
- Copying a threshold from a blog post, an industry peer, or a previous vendor’s system
- Measuring success solely by fraud rate while ignoring approval rate
- Tightening thresholds aggressively during an attack and never relaxing them once it passes
- Treating raw accuracy as the headline metric when fraud events are rare
That last point deserves emphasis. When fraud represents a small fraction of all orders — as it does in nearly every payment portfolio — a model can appear highly accurate while catching very little actual fraud. Precision (what share of flagged orders are genuinely fraudulent) and recall (what share of total fraud the model catches) are far more informative. Our guide to machine learning fraud detection explains both metrics and the precision-recall trade-off in plain terms.
For merchants and fintech teams operating in regulated industries, the Federal Reserve’s SR 11-7 model risk management guidance — co-issued with the OCC’s Supervisory Guidance on Model Risk Management — sets supervisory expectations for model documentation, validation, and ongoing monitoring that apply directly to fraud scoring models used by regulated financial institutions.
People Also Ask
Is a fraud score the same as a credit score?
No. A credit score — such as those produced by FICO, Equifax, Experian, or TransUnion — estimates how likely a borrower is to repay debt based on their longer-term credit history. A fraud score estimates how likely a specific transaction or account action is to be fraudulent right now, based on real-time signals. A fraud score can change from one transaction to the next. A credit score changes slowly over months. The two scores are generated by different parties, serve different purposes, and are generally not visible to each other.
For a related perspective on how BNPL and fintech algorithms use real-time scoring to make credit decisions — which overlaps with but is distinct from fraud scoring — see TechCapitalHub’s guide to how AI algorithms decide BNPL creditworthiness.
Can I see my own fraud score?
Generally not. Merchants, processors, and banks generate fraud scores internally and do not share them with customers. If a payment is declined, your best option is to contact your bank or the merchant directly.
How fast is real-time fraud scoring?
Real-time fraud scoring must complete within the payment authorization window. Fraud engines typically evaluate risk in well under a second — often within tens to hundreds of milliseconds — allowing the decision to complete before the customer notices any delay. Exact speed depends on the vendor, the integration architecture, the number of external data sources queried, and whether the model runs on the merchant side, the processor side, or the issuer side.
Does a high fraud risk score mean a transaction is fraud?
No. A high score means the transaction pattern resembles past fraud based on the signals the model has seen. Because legitimate payments vastly outnumber fraudulent ones in any payment portfolio, many high-scoring transactions are still genuine. That is precisely why step-up authentication and manual review exist — to collect additional evidence before a final decision is made.
Do fraud scoring models use AI?
Most modern fraud scoring models use machine learning, commonly layered alongside explicit business rules. Rules enforce known policies and handle clearly defined patterns. Machine learning weighs many signals simultaneously and adapts as it is retrained on new labeled data. Our guide to machine learning fraud detection covers the most commonly used algorithms in depth.
Can a fraud scoring model be wrong?
Yes, in both directions. It can approve a fraudulent transaction (a false negative) or block a legitimate customer (a false positive). Every model involves a trade-off between these two error types, and the threshold setting determines where that balance lands. Our guide to false positives in fraud detection covers how to measure and reduce both kinds of errors.
What is the difference between a fraud score and a risk level?
A fraud score is a numerical output. A risk level is a simplified categorical label — such as “normal,” “elevated,” or “high” — that groups scores into actionable bands. Many tools display both, and many merchants configure their rules around the bands rather than the exact numerical score. This makes rules easier to read and audit, especially for teams without deep data science expertise.
Conclusion: Review Your Thresholds Against the Walk-Through Table
A fraud scoring model converts dozens of signals into one fast judgment — but the score is only half of the system. The other half is the threshold you choose and the actions you attach to each score band. Get those wrong, and even a technically strong model will either let fraud through or quietly erode revenue by blocking legitimate customers.
Your next step: Pull your last 90 days of orders that are old enough for chargebacks to have settled. Group them by score range, then build your own version of the threshold walk-through table — including a net-cost column that adds fraud losses and lost revenue together. Compare the total cost at your current cut-off against two or three alternatives. If the gray zone in the middle is large, test EMV 3DS step-up authentication there before tightening your decline threshold further.
For the revenue cost on the other side of that decision, read our guide to false positives in fraud detection. If bursts of small, failed payment attempts are distorting your score distributions and triggering false alerts, start with our guide to card testing attacks.
Fraud Scoring Models · Editorial Integrity
Sources & Citations
The official documentation, regulator guidance, technical references, and internal reporting behind this guide to fraud scoring models, transaction risk scoring, false declines, threshold tuning, 3D Secure, and AI fraud detection.
We built this guide to answer a practical question: what does a fraud score actually mean, and how should merchants use it without blocking too many good customers? The article draws on technical references for probability calibration and model behavior, official payment-security documentation for EMV 3-D Secure, regulator guidance on authentication and model risk management, and consumer-protection materials explaining fraud, scams, and payment disputes.
We also use Tech Capital Hub’s own reporting on machine learning fraud detection, false positives, card testing attacks, behavioral biometrics, and AI fraud tools to connect the scoring model itself with the real business decisions around approvals, reviews, step-up authentication, and declines. Threshold examples in the article are illustrative rather than live scoring benchmarks, and practices vary by merchant, processor, issuer, and risk appetite.
View full sources, methodology, and editorial notes
This is an educational guide for merchants, operators, fintech readers, and anyone trying to understand how fraud scoring works in practice. We wrote it using primary technical documentation, official standards bodies, regulator guidance, consumer-protection materials, and Tech Capital Hub’s own supporting articles where they directly expand on the topic.
These sources support the article’s explanation of what a fraud scoring model is, how models convert many weak signals into a risk score, why scores differ across vendors, and how thresholds affect the trade-off between fraud caught and legitimate orders blocked. They also support the sections on EMV 3-D Secure, real-time decisioning, model calibration, label delay, false positives, account risk, and threshold tuning. Numerical examples in the article are simplified illustrations for teaching purposes, not universal benchmarks or vendor-specific recommendations. This article is general educational information and does not constitute financial, legal, compliance, or tax advice.
- Technical reference on calibration and probability outputs: scikit-learn — Probability calibration — cited for explaining calibration, probability estimates, and why model scores may rank risk correctly while still overstating or understating the true fraud rate.
- Official payment-security standard for step-up authentication: EMVCo — EMV 3-D Secure — cited for how EMV 3DS works, when frictionless and challenge flows apply, and why it is commonly used as a step-up tool in the middle risk band.
- Industry resource on EMV 3DS programs and monitoring: U.S. Payments Forum — EMV 3DS Mini-Series — cited for network monitoring context, merchant program implications, and practical background on EMV 3DS adoption and use.
- European regulator framework for strong customer authentication: European Banking Authority — PSD2 SCA and secure communication RTS — cited for the regulatory context that made step-up authentication and EMV 3DS more prevalent in Europe and the United Kingdom.
- Official digital identity guidance for risk-based authentication: NIST SP 800-63B — Digital Identity Guidelines — cited for the concept of applying additional authentication when risk justifies it, rather than using uniform friction for all users.
- Federal supervisory guidance on model risk management: Federal Reserve — SR 11-7 Model Risk Management — cited for governance, validation, documentation, and ongoing monitoring expectations relevant to regulated institutions using fraud scoring models.
- Related supervisory guidance from a U.S. banking regulator: OCC — Supervisory Guidance on Model Risk Management — cited alongside SR 11-7 for oversight expectations around model use, validation, and performance monitoring.
- Consumer guidance on disputes and cardholder rights: Consumer Financial Protection Bureau — Billing dispute guidance — cited for practical consumer context when legitimate payments are declined or challenged and readers need to understand the next step.
- Federal consumer-protection guidance on imposter scams: Federal Trade Commission — Imposter scams — cited for the warning that fraud-related calls or texts can themselves be social engineering attempts.
- Industry research on multi-model fraud scoring: LexisNexis Risk Solutions — Single vs. multi-models — cited for the idea that different fraud types may be detected more effectively when scored through distinct patterns and model approaches rather than one collapsed score.
- Research reference on 3-D Secure fraud detection: ResearchGate — Investigation of 3-D Secure’s Model for Fraud Detection — cited for academic discussion of the factors used in 3DS 2.0 risk decision-making and the frictionless-versus-challenge trade-off.
- Internal guide to the broader machine-learning foundation: Tech Capital Hub — Machine Learning Fraud Detection — cited for the deeper explanation of algorithms, feature engineering, labels, precision, recall, and retraining behind modern fraud scoring systems.
- Internal guide to the revenue cost of false positives: Tech Capital Hub — False Positives in Fraud Detection — cited for the practical downstream cost of blocking legitimate customers and how to think about approval-rate trade-offs.
- Internal guide to high-velocity payment abuse: Tech Capital Hub — Card Testing Fraud — cited for velocity patterns and bursty attack behavior that often influence transaction scoring systems.
- Internal guide to behavioral signals in fraud prevention: Tech Capital Hub — Behavioral Biometrics in Banking Fraud Prevention — cited for the role of device and behavioral signals that are difficult for attackers to replicate at scale.
- Internal review of a major built-in fraud tool: Tech Capital Hub — Stripe Radar Review — cited where the article references how processors and platforms may expose scores, risk bands, and merchant-facing fraud controls.
- Internal guide connecting AI to the larger fraud-detection stack: Tech Capital Hub — AI Fraud Detection — cited for the broader context of where fraud scoring fits within end-to-end payment and account-risk systems.
Fraud Scoring Models · Editorial Standards
Our Editorial Standards
Tech Capital Hub applies Google’s E-E-A-T framework to every guide on AI fraud detection, fintech infrastructure, and payment risk, including this one on fraud scoring models. We prioritize clear explanations, official standards, credible technical references, and honest trade-off analysis over vague AI claims or vendor hype.
In this article, the technical foundation comes from sources such as scikit-learn’s calibration documentation, EMVCo’s 3-D Secure materials, the European Banking Authority’s PSD2 guidance, NIST’s digital identity guidelines, Federal Reserve and OCC model risk guidance, and consumer-protection materials from the FTC and CFPB. We also connect those primary sources to Tech Capital Hub’s internal reporting on machine learning fraud detection, false positives, card testing fraud, behavioral biometrics, and AI fraud tools. Fraud systems, thresholds, attack patterns, and authentication practices evolve over time, so we review examples and references periodically rather than treating them as permanently fixed.
View how our editorial standards apply to this article
Built Around Real Merchant and Operator Questions
We built this guide around the practical questions merchants, fraud teams, fintech operators, and curious readers actually ask. What does a fraud score mean in plain English? Why can the same transaction score differently across systems? When should a payment be approved, reviewed, challenged, or declined?
We also focus on the uncomfortable real-world trade-off that matters most in production: every threshold change affects both fraud caught and good customers blocked. That makes this a decision guide for real payment flows, not a vague explainer about AI.
Technical Concepts Explained Without Jargon Overload
This article explains how fraud scoring models work at an applied level. That includes signals from transactions, devices, identity, behavior, and networks; probability outputs and calibration; vendor score scaling; threshold setting; label delay; and the role of step-up authentication such as EMV 3-D Secure.
We define technical terms before using them and translate model concepts into operational decisions. The goal is not just to explain how a score is calculated, but how to use it responsibly inside a real fraud workflow.
Primary and Official Sources Where Precision Matters
We anchor accuracy-sensitive claims to official documentation, standards bodies, regulator guidance, and well-established technical references. EMVCo supports the 3DS explanation, the EBA and NIST support the authentication framework, and Federal Reserve and OCC materials support the discussion of model oversight and monitoring. Technical references and industry materials support points on calibration, model outputs, and detection strategy.
Relevant Tech Capital Hub guides extend the article’s topic cluster, including machine learning fraud detection, false positives, card testing fraud, behavioral biometrics, and AI fraud detection.
Transparent About Limits, Context, and Trade-Offs
We state the limits of the article clearly. Score thresholds in the guide are illustrative, not universal benchmarks. Model outputs differ by vendor, data access, calibration method, fraud mix, and business context. Real fraud losses and false-decline costs vary by margin, chargeback exposure, shipping cost, and lifetime customer value.
We do not present any score as proof of fraud or any single control as a complete solution. This article is educational information, not financial, legal, regulatory, or compliance advice. Readers should validate live thresholds, model behavior, and vendor definitions against their own systems and current documentation.
Fraud Scoring Models · About the Author
Marcus Delray
Fintech Analyst · Founder of Tech Capital Hub
Marcus Delray is a fintech analyst and the founder of Tech Capital Hub. In this guide, he explains how fraud scoring models turn transaction, device, identity, behavioral, and network signals into a fast risk score that can approve, review, challenge, or decline a payment. He also breaks down how thresholds affect both fraud losses and legitimate customer approvals, so readers can understand the real trade-offs behind modern fraud controls.
View full author bio, credentials, and links
Marcus Delray has spent more than a decade researching financial technology, payment systems, fraud infrastructure, blockchain, and the software decisions that shape how money moves online. He built Tech Capital Hub to make complex fintech topics practical for operators, founders, investors, and curious readers who want clear explanations instead of vague industry jargon.
For this guide, Marcus focuses on the operational questions that matter most in real fraud workflows. What does a fraud score actually mean? Why can one vendor score the same order differently from another? When should a business approve, review, step up, or decline a transaction? He explains the logic behind model signals, probability calibration, score bands, and threshold tuning in plain English, then ties those concepts back to false declines, 3D Secure, label delay, and business cost trade-offs.
His goal is not to present fraud scoring as a black box or a magic answer. It is to help readers understand what these systems are doing, where they go wrong, and how to think more clearly about risk decisions in production. All articles are educational information, not financial, legal, compliance, or tax advice.
- Explains how fraud scoring models combine transaction, device, identity, behavior, and network signals into a risk score
- Breaks down fraud score meaning, model calibration, and why different vendors produce different score ranges
- Shows how thresholds influence fraud caught, false positives, manual review load, and lost revenue from good orders
- Covers step-up authentication, EMV 3-D Secure, and the operational role of review bands between approval and decline
- Connects model theory to practical fraud operations, including velocity attacks, label delay, drift, and score tuning
Enjoying our content?
Click below to add us as a preferred source. Google will prioritize our latest articles in your Top Stories, AI Mode, and AI Overviews.
Preferred Source on Google