How to Automate a 13-Week Cash Flow Forecast with AI: A Step-by-Step Guide
Last Updated: April 2026
Disclosure: Some platforms mentioned here have affiliate links. If you buy through one, we get a small cut — no extra cost to you. Nobody paid to be included.
I spent three years building 13-week cash flow forecasts by hand. Every Monday. Without fail.
You pull the ERP export. You clean it. You paste it into the model. You add the bank balances — manually, because the bank portal doesn’t talk to anything. You update the AR assumptions based on what collections told you Friday afternoon. You send it by 9am.
And then half the time, week 6 or week 7, something is off by enough to matter. A customer paid late. A dispute nobody logged. A payment that cleared the weekend before but wasn’t in Monday’s export yet. You find out when the actuals land.
I thought this was just how forecasting worked. Turns out it’s how manual forecasting works. There’s a difference.
The average accuracy of a manually built 13-week cash flow forecast is around 60%, according to treasury research I’ve seen cited consistently across the last few years. Sixty. Which means you’re wrong on 40 cents of every dollar you try to predict. And the decisions sitting on top of that number — whether to draw on a credit line, when to pay vendors, whether you have real covenant headroom — those decisions get made anyway.
AI doesn’t just speed up the old process. It fixes the structural problem. Here’s how.
For a broader look at how AI is reshaping treasury operations overall, see our complete guide to AI cash flow forecasting.
Why 13 Weeks Cash Flow Forecast Specifically
I get asked this a lot, usually from people who prefer daily rolling forecasts or monthly variance analysis.
Daily is too noisy. You’re chasing clearing differences and timing variances that net out by Thursday. Monthly is too slow for liquidity decisions — if you’re looking at a covenant breach, you need to know in week 4, not in the month-end close.
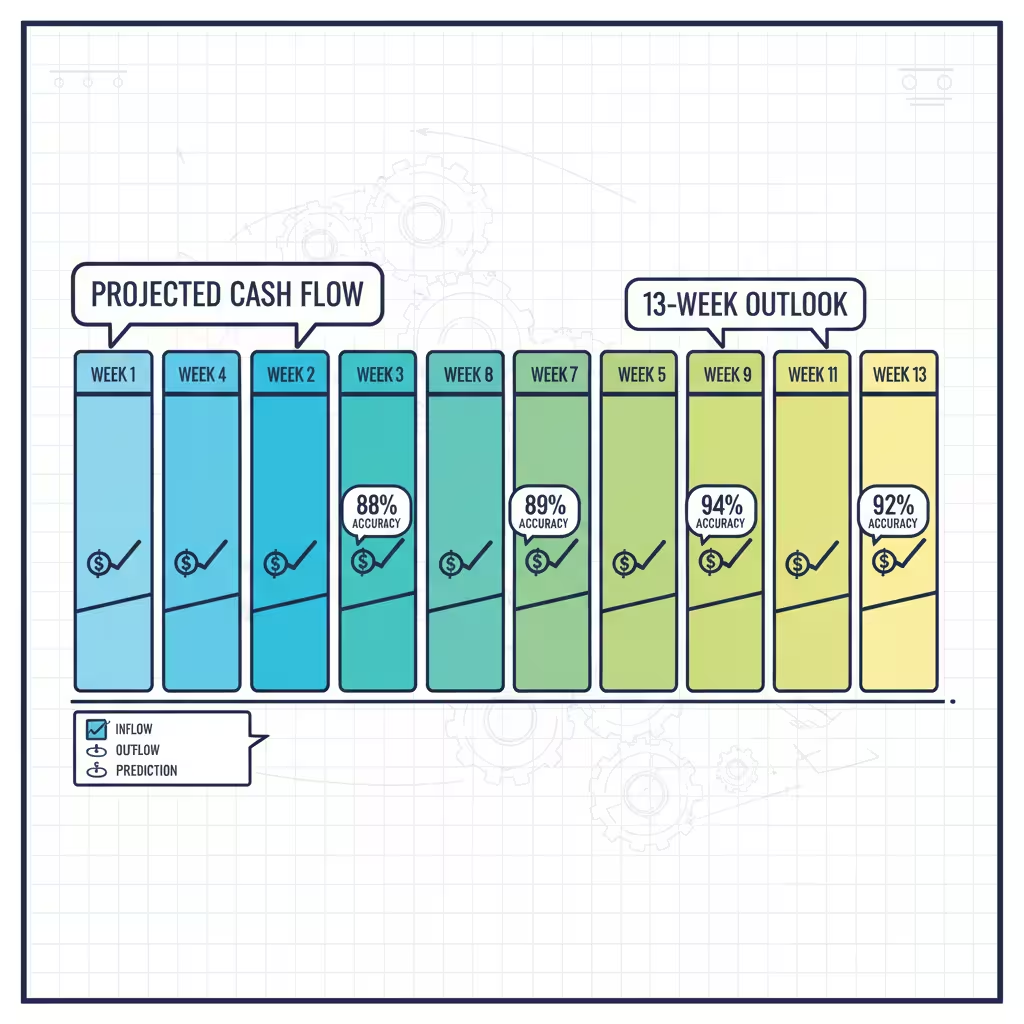
Thirteen weeks is one quarter. Weekly buckets. Enough resolution to see what’s actually moving, enough horizon to do something about it before it becomes a crisis. It’s also the window where AI accuracy improvements are most dramatic. Manual sits at 60%. AI-driven models reach 88 to 92% at this horizon. That 30-point gap is real and it changes what treasury can actually commit to.

Step 1: Deal With Your Data First — Before Anything Else
Nobody wants to hear this. I didn’t want to hear it the first time either.
There’s this temptation to buy a platform, connect it to your systems, and watch the magic happen. I understand it. The demos are impressive. The vendors are convincing. And the first thing they’ll tell you — if they’re honest — is that the tool is only as good as what you feed it.
A forecasting model on dirty data doesn’t produce messy forecasts. It produces clean-looking forecasts that are wrong. Which is significantly worse, because at least a messy spreadsheet looks unreliable.
So before you log into anything:
• Look hard at your AR aging report. I mean actually look at it — not a quick scan. Is dispute status live in there? Are matched invoices updating in real time, or is this yesterday’s snapshot from an ERP batch job? If you’re working from nightly exports, your forecast is missing everything that happened today.
• Document your data lineage. For each major input: where does it come from, how fresh is it, and how often does it update? If you can’t answer that for every source, you have spreadsheets, not a data foundation.
• Find your single source of truth. At most mid-market companies, AR is in one system, AP is somewhere else, payroll exports from a third tool, and bank balances get typed in by someone on Monday morning. That’s the actual status at most places I’ve seen. AI needs one consistent feed. Getting there is boring infrastructure work. It also determines whether any of the rest of this matters.
Budget four to eight weeks for this phase. Teams that rush it don’t save time — they just spend the same time fixing things after go-live instead of before. It’s worse that way because you’re doing it under pressure.
Step 2: Replace Batch Exports With Live Connections
The whole point of batch exports is that they’re easy. Scheduled, automated, reliable. The problem is what they miss.
A wire that cleared Saturday night doesn’t exist in your Monday ERP export. A dispute opened at 8am this morning won’t appear until tonight’s batch. By the time your forecast reflects reality, reality has already moved.
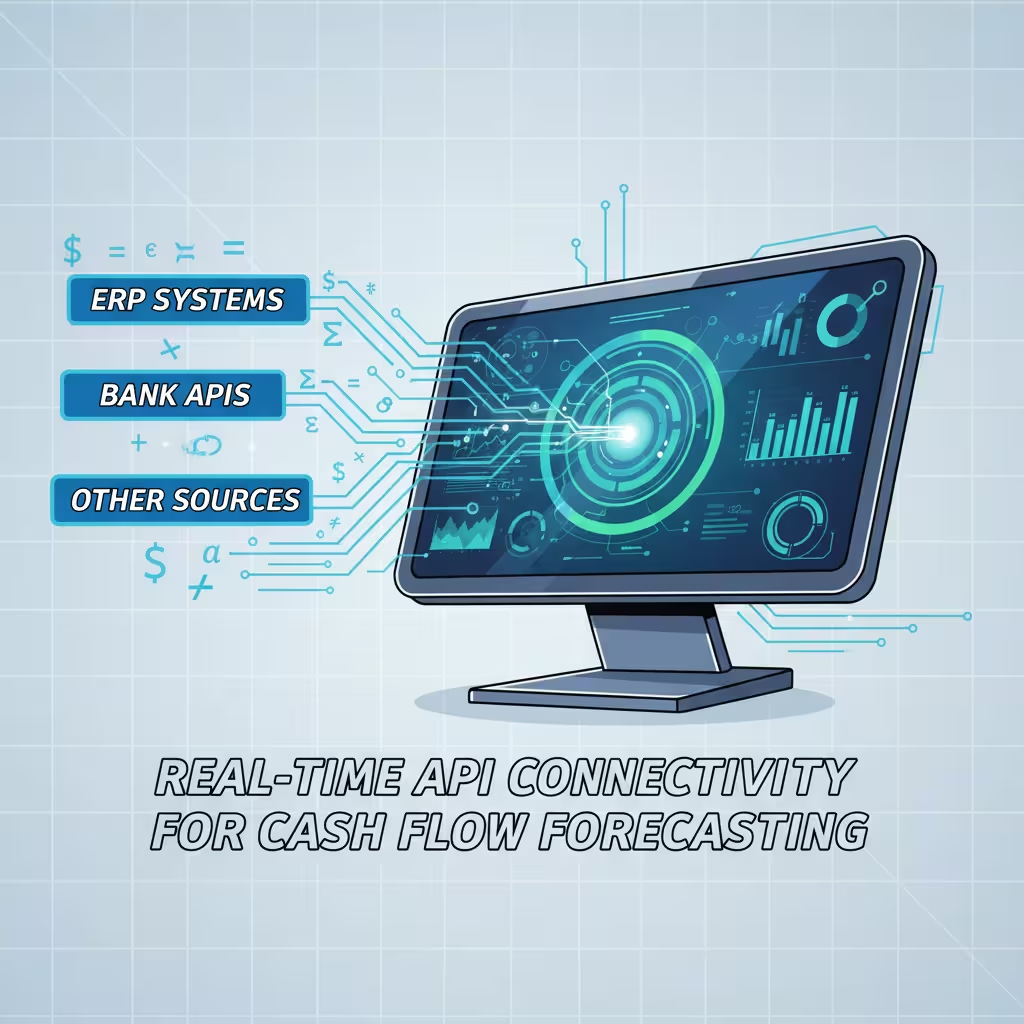
Real-time API connections fix this. NetSuite, SAP, Oracle — all of them now have REST APIs that push AR aging, open invoices, and purchase orders continuously. Connecting these APIs cleanly is trickier than vendors let on — we go deep on the specifics in our guide to integrating AI forecasting with your ERP (NetSuite, Sage, QuickBooks). No schedule. No lag. A dispute logged at 10am updates the forecast by 10:01.
On the banking side, direct bank APIs or SWIFT MT940 feeds replace the manual statement download. JPMorgan, Wells Fargo, HSBC — they all support this. Actual cash positions across every account and entity, live.
Why does the opening position matter so much? Because every week’s forecast inherits from the week before. If week one’s starting cash is $200K off, that error rides forward through all 13 weeks. Week 13’s projection is wrong before you even got to the assumptions.
Quick note on something called ISO 20022, which comes up a lot in treasury circles and usually gets explained poorly:
It’s a messaging standard for financial data exchange. What makes it useful for AI forecasting is that it carries metadata — not just “payment moved” but which invoice, which entity, what the line-item relationship is. AI systems on ISO 20022 data hit 98% transaction categorization accuracy. Older formats land at 70 to 80. That gap feeds directly into forecast accuracy.

Step 3: Let the Model Run Before You Trust It
Here’s where most teams blow it.
They get the platform set up, the data connected, and immediately switch over from their manual model. Something looks off two weeks later and everyone decides the AI doesn’t work.
Every serious forecasting platform has what’s called a learning period — 30 to 60 days where it backtests against historical data to figure out which modeling approach fits each cash flow type.
What that means practically: fixed payments like rent get a simple straight-line model. Nothing complicated needed. Payroll might need an LSTM — that stands for Long Short-Term Memory, a deep learning approach for time-series data — because pay timing varies with headcount and calendar. Your biggest customer’s AR might need something called a Transformer model because their payment behavior is tied to freight costs, their own inventory cycles, things the model needs to learn.
None of this needs manual configuration. The system figures it out. But it needs the time.
Run both models in parallel for four to six weeks. Old method, new system, side by side. See where the AI beats you and where it still needs work. That comparison is also what builds buy-in from the team — nobody trusts a black box, but people trust something they’ve watched be right for six weeks.

Step 4: Understand What’s Actually Running Under the Hood
I want to demystify this a little, because vendors tend to oversell the magic and underexplain the mechanics.
The 13-week forecast is not one model. It’s a stack of parallel models, each assigned to a different category of cash flow, each running on its own data signal. Four types do most of the work:
• Collection prediction agents — these work at the individual invoice level, not segment averages. A customer with two years of on-time payments gets a 95% probability. If late payments are your main pain point, we’ve covered exactly how AI pattern recognition handles predicting late payments and fixing accounts receivable in detail. One with three recent disputes gets 60% and a 45-day window. Both look the same in your AR aging as “outstanding.” The model treats them nothing alike.
• Payment timing agents — AP side. When do you pay each vendor to capture early payment discounts without straining the cash position at a bad moment? This is active working capital management, not passive tracking.
• Scenario agents — what if your biggest customer stretches 30 days? What if freight costs spike 15%? What if you accelerate collections on the top 20 accounts? Used to take two days to model. Now it runs during the meeting where the decision is made.
• Variance alert agents — monitor actuals against forecast. Anything above your threshold gets flagged. What’s useful is not just the flag — it’s that the system tells you whether it’s a timing issue (money’s still coming, just late) or a real loss. That distinction changes what you do next.
The thing most people miss: these agents update independently. A change in your largest customer’s dispute status updates the collection agent immediately, while the payment timing agent keeps running on the AP data it has. The forecast is always reflecting the freshest version of each data type it tracks.
Step 5: Build in Scenario Stress Testing
Traditional 13-week forecasts give you one number per week. One column. You build it, you present it, you find out later whether you were right.
That single-point estimate is genuinely useless for board conversations about covenant headroom. “We expect to be here” is not the same as “here’s the range of where we could land and what would have to happen at each end.”
AI adds probability distributions. The engine under this is Monte Carlo simulation — the system runs thousands of variations across all your inputs, varying payment timing, rates, operational assumptions. The output is a distribution. Median outcome, downside scenario, tail risk. All in one view.
The better platforms also do something called action-linked simulation. You specify a decision — accelerate collections on the top 20 accounts by one week, defer three non-critical vendor payments — and the model shows the effect on every week of the 13-week horizon. It tells you what improves, what new exposure gets created, and how to sequence the moves.
I’ve sat in board meetings where the CFO had to say “we expect X” and then field thirty minutes of questions about downside scenarios she couldn’t answer in real time. With a proper stress testing layer, those questions get answered before the meeting starts.
Step 6: Switch to Managing Exceptions, Not the Forecast Itself
This is the operational change that most people underestimate.
Once the model is live and calibrated, your team’s job stops being “build the forecast every Monday” and starts being “review what the forecast flagged and decide whether the flag is right.”
The system pulls actuals, compares to forecast, and flags deviations above your threshold automatically. Below threshold — the model handles it. Nobody touches it. You focus on the things that actually need a human decision.
That usually means: reviewing the flagged exceptions, adding context the model doesn’t have (a customer relationship changing, a vendor negotiation in progress), and making calls on the scenarios the system surfaced.
The organizational effect of this is real and I don’t think it gets talked about enough. Companies that make this shift report 30 to 45% higher engagement in finance roles and 20 to 30% lower turnover. The explanation isn’t complicated. The work gets more interesting. People who went into finance to think about problems find there are suddenly more problems to think about and fewer Monday morning data pulls to do.
For controllers and senior analysts specifically: the job doesn’t get smaller. It gets different. The skill that matters now is knowing when the model is wrong — not because the data is bad, but because something is happening at the business level that isn’t in the data yet. That’s harder than building the spreadsheet. It’s also harder to outsource.

Step 7: Governance — Less Boring Than It Sounds, More Important Than You Think
I know. Nobody wants to read a section on governance. I’ll keep it practical.
The U.S. Treasury’s Financial Services AI Risk Management Framework covers 230 control objectives across the AI lifecycle. The Colorado AI Act, effective June 2026, requires impact assessments for AI systems making high-risk financial decisions — and liquidity forecasting qualifies. Texas TRAIGA requires disclosure when counterparties are interacting with AI agents. These are not hypothetical future requirements.
More immediately: if your AI model recommends drawing on a credit line and your CFO asks why, “the algorithm said so” is going to end the conversation in a bad way. The reasoning chain needs to be visible. What inputs drove the recommendation. What probability threshold triggered it. What assumptions the model made. Not just for the audit — for internal credibility.
One thing most teams don’t account for: the right to unlearn. Emerging regulations require that when sensitive data is deleted from your systems, it also gets removed from model weights — not just the database. That means your data governance policy needs to cover not just storage and retention, but model retraining when data gets pulled. Build this before an audit asks about it.

The Platforms Worth Looking At
No paid placements here. These are based on published specs and independent research, not vendor briefings.
• Transformance. For AR-heavy mid-market companies, this is where I’d start. CashPulse runs off processed AR data — matched payments, active disputes, promise-to-pay dates — not raw ERP exports. That input difference matters more than any feature list. Four to eight weeks to implement.
• HighRadius. Large enterprises with deep AR complexity. 100-plus ML models, seven specialized agents, end-to-end automation. Three to six months to implement — that timeline reflects integration depth, not product problems.
• Trovata. Fastest path for upper-mid-market teams. Direct bank API streaming, NLP search, one to three months out. If you have the treasury expertise but not the IT infrastructure, Trovata closes that gap fast.
• Kyriba. Strongest bank connectivity — 10,000-plus institutions — with FX hedging built in. If you’re managing multi-currency exposure across a lot of banking counterparts, this is the one to evaluate.
• Cube. Excel-native teams who aren’t ready to leave spreadsheets. Real-time GL integration, two to four weeks to implement. It’s the migration on-ramp, not the destination — but for some teams that’s exactly what’s needed.
One honest note: the platform that’s right for a Fortune 500 treasury team with 40 banking relationships will probably overwhelm a $75M company running NetSuite. Match the tool to the actual bottleneck, not the most impressive demo.
How to Know If It’s Working
Three numbers. Watch them in the first 90 days.
• MAPE improvement at the 13-week horizon. You want 28 to 32 percentage points of accuracy gain. Not seeing that by week 12? The data foundation has a problem, or the learning period was cut short. Go back to the data layer first.
• Forecast build time. Should drop from three to four hours per week down to under 15 minutes. If it hasn’t, data connections aren’t working right — someone is still doing manual prep somewhere in the process.
• DSO and DPO movement. Days Sales Outstanding and Days Payable Outstanding should improve by two to four days in 90 days. That’s real working capital freed up — not from squeezing vendors, from predicting better.
If any of those three don’t move in the right direction, don’t touch the model settings. Go back to the data.
People Also Ask – PAA’s
What is a 13-week cash flow forecast?
A rolling 90-day projection of weekly cash in and out. Standard tool for short-term liquidity management. It matters because it sits between daily positioning — too reactive to be useful — and annual budgets — too abstract for real decisions. The 13-week window is where actual funding decisions get made.
How does AI actually improve accuracy — what’s the mechanism?
Two things. Real-time data instead of batched exports, and invoice-level predictions instead of segment averages. Both matter. Fix the data freshness without improving prediction granularity and you get partial improvement. Do both and you move from 60% to 88 to 92%.
How long does implementation really take?
Weeks one through eight: data cleanup. Weeks three through eight, overlapping: live API connectivity. Weeks eight through fourteen: Auto-ML learning period, running parallel with your existing model. Months four through eight: exception-based management goes live. Month nine onward: governance, model drift monitoring.
What’s the learning period for?
The platform backtests your historical data to match each cash flow category to the right model type. Takes 30 to 60 days and can’t be skipped. Teams that skip it and go live immediately spend more time fixing problems on the back end — not less.
Why do most of these implementations fail?
Same answer almost every time: data problems that weren’t fixed before go-live. Plus: skipping parallel running, no clear owner for exception review, and underestimating what governance actually requires in 2026.
What This Actually Changes
The AI accounting market is $10.87 billion. That number isn’t driven by good marketing. It’s driven by implementations that produced results manual processes couldn’t match.
A 13-week forecast at 90% accuracy isn’t a marginal improvement over 60%. It changes what you can say in a board meeting. A CFO with a real probability distribution doesn’t present a number and hope — she presents a range, explains the conditions, and handles the questions before they get asked.
I’m not going to pretend the implementation is painless. Step 1 is genuinely slow. The parallel running period requires patience. Governance takes longer than anyone budgets for. This is real work.
But here’s the thing I keep coming back to: if your forecast has been missing consistently — and you’ve cleaned the data, updated the methodology, added detail to the model — the spreadsheet probably isn’t the problem anymore. Something underneath it is.
Disclaimer: Informational only. Not financial, legal, or investment advice. Accuracy figures from published treasury research and vendor documentation. Your results will depend on your data quality, implementation choices, and business context. Evaluate any platform against your own requirements first.