Machine Learning Fraud Detection: How the Models Actually Work


Fintech Analyst · Founder of Tech Capital Hub
Marcus covers AI fraud detection, payment risk, and financial technology in plain English for merchants, operators, and curious readers. In this guide, he explains how machine learning fraud detection works in practice, from labels and feature engineering to model choice, threshold setting, and ongoing monitoring. He breaks down the trade-offs between catching more fraud and blocking good customers, shows why precision, recall, and real business costs matter more than raw accuracy, and explains where fraud models fail through drift, cold start, bias, and fraudster adaptation.
- Machine Learning Fraud Detection
- Fraud Detection Models
- Precision and Recall
- False Declines
- Model Drift
- Payment Risk
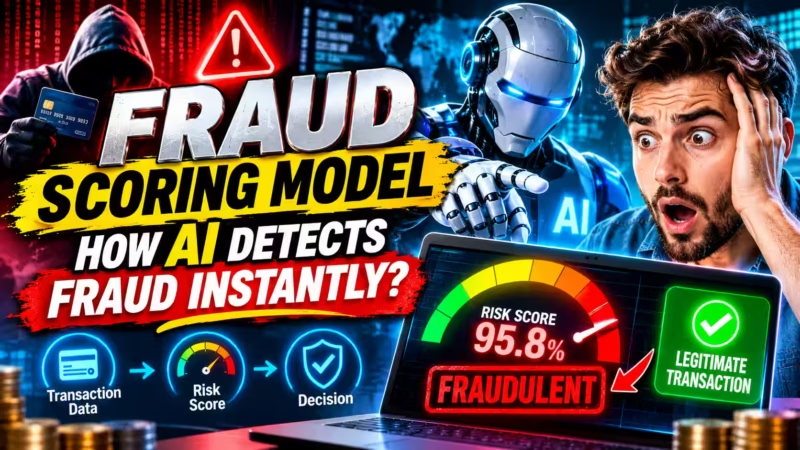
Machine learning fraud detection uses models trained on past transactions to estimate how likely a new payment, login, or account action is to be fraudulent. The model returns a risk score, and the business compares that score to thresholds. Depending on the result, it approves the action, asks for more verification, sends it to a human reviewer, or declines it.
Machine learning is one part of the broader field of AI fraud detection, which also includes rules engines, identity verification, and specialist vendor tools. This guide focuses on the models at its center.
The hard part is that fraud is rare. In the most widely used public card dataset, fraud makes up about 0.17% of transactions. A model that never flags anything would still be right more than 99.8% of the time on that data. It would also be useless.
This guide explains how fraud detection using machine learning works from the inside. It covers the data and labels models learn from, the algorithms teams actually use, and how to judge a model when fraud is rare. It also shows how scores become decisions and where these systems break down. It ends with a readiness checklist to help you decide whether your business needs its own model.
Key takeaways
- Data and labels matter more than the algorithm. A simple model trained on clean labels often beats a complex model trained on messy ones.
- Accuracy is the wrong headline metric. When fraud is rare, precision, recall, and dollar costs tell you far more.
- Every fraud model trades caught fraud against blocked customers. Where you set that balance is a business decision, not only a technical one.
- Models decay as fraud changes. Monitoring and retraining are part of the system, not optional extras.
Table of Contents

What Is Machine Learning Fraud Detection?
Machine learning fraud detection is the use of statistical models that learn fraud patterns from historical data and apply them to new events, often in real time. People don’t write the logic by hand. The model learns which combinations of signals tend to show up before confirmed fraud, then gives each new event a score.
In plain terms, the model asks one question about every transaction: how much does this look like fraud we’ve seen before?
Machine Learning Fraud Detection Examples
ML models for fraud detection run across payments, banking, and commerce. Common uses include:
- Online checkout scoring: Merchants and payment processors score card-not-present orders before they capture the payment.
- Card authorization scoring: Card issuers score authorization requests in milliseconds and decide whether to approve them.
- Account takeover detection: Login and session models flag access that looks like it comes from someone other than the account owner.
- New account fraud: Onboarding models look for stolen or synthetic identities at sign-up.
- Card testing detection: Velocity-based models catch bursts of small authorization attempts that fraudsters use to check stolen card numbers.
- Policy abuse: Models flag refund fraud, promo abuse, and reseller bots that don’t involve stolen credentials.
Several of these uses are publicly documented by the companies that run them. Stripe, for example, says its Radar fraud tool scores payments with machine learning models trained on data from across the Stripe network. Visa describes its Advanced Authorization service as scoring the risk of card transactions in real time for issuing banks. Both are vendor descriptions of how their products work, not independent evaluations of how well they perform.
How Machine Learning Differs From a Rules Engine
A rules engine runs explicit “if-then” logic written by people. For example: if more than five cards are tried from one device in an hour, block the device. Rules are transparent and quick to deploy. They’re also rigid, and fraudsters learn to stay just under the limits.
A machine learning model weighs many weak signals at once and learns how much each one matters. No single signal has to cross a hard line. A high score can come from several small warning signs adding up.
Most production systems use both. Rules handle known attacks and hard policy limits, while models handle subtle patterns that no one thought to write a rule for.
Where a Fraud Detection Model Fits in the Fraud Stack
A fraud detection model is one component in a larger decision system. A typical stack has seven layers:
- Data collection: Transaction, device, identity, and behavior data is captured at checkout or login.
- Rules as guardrails: Hard blocks, allow lists, and velocity limits run first.
- Model scoring: The machine learning model returns a risk score.
- Decision logic: Thresholds turn the score into an action.
- Step-up authentication: Uncertain cases get a challenge, such as EMV 3-D Secure or a one-time passcode.
- Manual review: Analysts check cases the system can’t decide with confidence.
- Feedback loop: Chargebacks, review outcomes, and customer reports flow back in as training labels.
When teams say a fraud model “isn’t working,” the cause is often somewhere else in the stack. A strong model with poorly set thresholds or a broken feedback loop will still produce poor results.

The Data Behind Every Fraud Detection Model
Fraud model performance depends more on data quality than on algorithm choice. A model can only learn what its data shows, and fraud data has quirks that most prediction problems don’t.
What Each Signal Group Contributes to Training
Most fraud models learn from five groups of signals. Each one teaches the model something different:
- Transaction signals (amount, product, time, shipping method) teach the model what risky orders look like.
- Device signals (device fingerprinting, IP address, browser setup, proxy use) teach it to recognize risky environments, even when the card and name look clean.
- Identity signals (email age, phone data, address verification and CVV results) teach it whether the person matches the payment details.
- Behavior signals (typing rhythm, navigation, session speed) teach it whether a human or a script is at the keyboard. Our explainer on how behavioral biometrics spot account fraud covers this in depth.
- Network signals (shared devices, cards, emails, and addresses across accounts) teach it to see connections that single transactions hide.
Where Fraud Labels Come From, and Why They Arrive Late
Supervised fraud models learn from labeled data, meaning past transactions marked as fraud or legitimate. In fraud, those labels come from several imperfect sources:
- Chargebacks: A cardholder disputes a charge, and the issuer reverses it.
- Customer fraud reports: Someone tells their bank or the merchant they didn’t make a purchase.
- Manual review decisions: An analyst confirms or clears a flagged order.
- Confirmed account takeovers: A security team verifies that an account was compromised.
The biggest problem is label delay. A fraudulent purchase can look fine for weeks. The cardholder has to notice it, often on a monthly statement, and then file a dispute. Card network dispute windows for many fraud-related reasons run up to roughly 120 days, though exact timelines vary by network and reason code.
Hypothetical label-delay timeline:
Training Data Timeline
Hypothetical Label-Delay Timeline
See how a fraudulent transaction can look legitimate for weeks before the label is reflected in model training data.
Day
Timeline checkpoint
|
What Happens
Real-world event
|
What the Training Data Shows
Model-side view
Key takeaway
|
|---|---|---|
| Day 0 | Fraud occurs A fraudster buys a $400 order with a stolen card. | Legitimate The transaction has not been disputed yet, so the training data still treats it as normal. Legitimate |
| ~25 | Cardholder spots the charge The customer notices the transaction on a statement. | Still legitimate Nothing has flowed back into the label system yet, so the example still looks clean in recent data. Still legitimate |
| ~30 | Dispute is filed The cardholder disputes the charge with the issuer. | Still legitimate Even though the dispute has started operationally, the training dataset usually has not updated yet. Still legitimate |
| ~45 | Chargeback posts The chargeback reaches the merchant and becomes a confirmed fraud signal. | Now labeled fraud This is the point where the historical data can finally mark the transaction correctly. Now labeled fraud |
| Next retrain | Label enters the training set The fraud label is included in the next retraining cycle. | The model can finally learn from it Only after retraining can this example influence future fraud predictions. Learnable signal |
Bottom line: Fresh data often looks safer than it really is because fraud labels arrive late. If you train or evaluate too close to the present, your model can underestimate actual fraud risk.
Label delay has a practical effect: recent data always looks cleaner than it really is. Fraud from last week hasn’t been reported yet, so a model trained or tested on very fresh data will underestimate fraud.
Fraud labels are also noisy in three common ways:
- Friendly fraud: A real customer disputes a purchase they made, which creates a false fraud label.
- Unreported fraud: Some fraud never gets disputed, so it stays labeled as legitimate.
- Inconsistent reviews: Two analysts may judge the same order differently.
Some fraud types rarely produce clean labels at all. Synthetic identities may never trigger a chargeback, because no real victim exists to notice. Our guide to synthetic identity fraud explains why this type is so hard to catch.
Feature Engineering in Plain English
Feature engineering is the work of turning raw data into signals a model can learn from. Three feature families do much of the heavy lifting in fraud:
- Velocity features count how often something happens in a short window, such as card attempts per device per hour or new accounts per IP address per day.
- Deviation features measure how far an event strays from normal. A $2,000 order from a customer who usually spends $40 stands out, and so does a login from a new country at 3 a.m. local time.
- Linked-entity features track details shared across accounts. How many accounts use this device? How many different cards ship to this address?
Velocity features explain why card-testing attacks are relatively easy to catch. An attack might involve dozens of $1 authorization attempts from one device in a few minutes. Each attempt looks harmless on its own, but a velocity feature reveals the burst right away. Well-designed features like this often improve a model more than switching to a more complex algorithm.

Supervised vs Unsupervised Fraud Detection
The right learning approach for fraud detection depends mostly on your labels: how many you have, how reliable they are, and how quickly they arrive.
Supervised Learning: Learning From Confirmed Fraud
Supervised models train on labeled examples of fraud and legitimate activity. They learn the patterns that separate the two and then score new events.
These models are good at catching fraud that resembles past fraud. They struggle when labels are scarce, late, or noisy, and when fraudsters switch to tactics the model has never seen.
Unsupervised Learning: Flagging the Unusual
Unsupervised models need no fraud labels. They learn what “normal” activity looks like and flag anything that doesn’t fit.
This makes them useful for spotting new fraud patterns and for businesses with little fraud history. The limitation is that unusual isn’t the same as fraudulent. A legitimate holiday shopping spike can look just as odd as an attack, so alert volumes can run high. Teams usually keep that noise in check by tuning alert thresholds, accounting for seasonality, and treating anomaly scores as one input rather than a final verdict.
Semi-Supervised and Hybrid Approaches
Many fraud teams combine supervised and unsupervised methods, because fraud labels are always incomplete. Common hybrid patterns include:
- Training on a small labeled set plus a large unlabeled one
- Feeding an anomaly score into a supervised model as one more input
- Running an unsupervised model alongside a supervised one to catch what the supervised model misses
Learning Approach Comparison
Supervised vs. Unsupervised vs. Hybrid Fraud Detection
The right approach depends on your labels: how many you have, how reliable they are, and how fast they arrive.
| Approach |
Data Needed
What it trains on
|
Catches Best
Core strength
|
Main Weakness
Where it falls short
|
Typical Use
Where teams apply it
|
|---|---|---|---|---|
| Supervised Needs labels | Labeled examples Past transactions marked as fraud or legitimate. | Known fraud Patterns similar to fraud it has seen before. | Blind to new tactics Only as good as its labels, which are often late or noisy. | Core scoring Payment and login risk scoring. |
| Unsupervised No labels | Unlabeled activity Raw behavior data that shows what “normal” looks like. | New or rare patterns Activity that doesn’t fit normal behavior. | High false alerts Unusual isn’t always fraud, like a holiday sales spike. | Cold start and discovery Thin fraud history or spotting new attacks. |
| Semi-supervised / hybrid Partial labels | A mix of both A few labels plus lots of unlabeled data. | Known and emerging fraud Covers past patterns and flags new ones. | More complexity Harder to build and maintain over time. | Mature fraud teams Teams working with partial labels. |
Bottom line: Fraud labels are always incomplete, so many teams blend both methods. A common setup feeds an anomaly score into a supervised model as one more input.
Common Machine Learning Algorithms for Fraud Detection
The fraud detection algorithms used most often, from simplest to most specialized, are:
- Logistic regression: Weighs each feature and outputs a probability. It’s fast, easy to explain, and a common baseline.
- Random forest: Many decision trees vote on the outcome. It handles mixed data types well and is fairly robust to noise.
- Gradient boosting (XGBoost, LightGBM, CatBoost): Builds trees in sequence, with each new tree correcting the errors of the last. It’s a common strong choice for tabular transaction data.
- Neural networks: Flexible models that can learn complex patterns, especially from sequences of events such as a session’s clicks.
- Isolation forest: An unsupervised method that isolates outliers with random splits. Rare points get isolated faster, as described in the original Isolation Forest paper by Liu, Ting, and Zhou.
- Autoencoders: Neural networks that learn to compress and rebuild normal data. Transactions they rebuild poorly get flagged.
- Graph neural networks: Models that learn from relationships between accounts, devices, cards, and addresses. They suit fraud rings and money mule networks. Our explainer on how graph neural networks detect money laundering shows the same idea in an anti-money laundering setting.
Algorithm Comparison
Common Machine Learning Algorithms for Fraud Detection
Seven algorithms fraud teams use most, from simple baselines to specialized network models.
| Algorithm |
Learning Type
How it learns
|
Interpretability
How easy to explain
|
Data Needs
What it requires
|
Typical Fraud Use
Where teams apply it
|
|---|---|---|---|---|
| Logistic regression | Supervised | High Clear weight for each feature. | Low to moderate Works well on smaller labeled sets. | Baselines Tightly regulated settings. |
| Random forest | Supervised | Moderate Many trees vote on each outcome. | Moderate Handles mixed data and some noise. | General scoring Everyday transaction risk. |
| Gradient boosting ★ Common starting point | Supervised | Moderate Easier to explain with tools like SHAP. | Moderate Strong fit for tabular transaction data. | Core payment scoring XGBoost, LightGBM, and CatBoost. |
| Neural networks | Supervised | Low Decisions are hard to trace. | High More data, compute, and engineering. | Behavioral sequences Very high transaction volumes. |
| Isolation forest | Unsupervised | Moderate Isolates outliers with random splits. | Unlabeled data No fraud labels required. | Pattern discovery Surfacing new fraud patterns. |
| Autoencoders | Unsupervised | Low Flags what it rebuilds poorly. | High, unlabeled Large volumes of normal activity. | Anomaly scoring Flagging outliers at scale. |
| Graph neural networks | Supervised or semi-supervised | Low Learns from complex connections. | Relationship data Links among accounts, devices, and cards. | Fraud rings Money mule networks. |
Bottom line: No single algorithm wins every fraud problem. Gradient-boosted trees are a strong start for transaction data, but clean labels and smart features usually matter more than the model you pick.
Which Algorithm Is Best for Fraud Detection?
No single algorithm is best for every fraud problem. For structured transaction data, gradient-boosted trees such as XGBoost and LightGBM are a common strong starting point.
Broader research on tabular data supports this pattern. The 2022 study Why Do Tree-Based Models Still Outperform Deep Learning on Tabular Data? by Grinsztajn, Oyallon, and Varoquaux found that tree-based models often beat deep learning on medium-sized tables. That’s a general finding, not a guarantee for any specific fraud problem.
Label quality and feature design usually matter more than the algorithm. Match alternatives to your data:
- Event sequences (clickstreams, login histories): neural networks
- Relationship data (shared devices, linked accounts): graph neural networks
- Few or no labels: isolation forest or autoencoders
- Strict explainability needs: logistic regression or constrained tree models
Why Deep Learning Isn’t Always the Upgrade
Deep learning fraud detection sounds like the natural next step, but it carries real costs. It needs more data, more computing power, and more engineering. Its decisions are also harder to explain to customers, analysts, and auditors.
Deep learning earns its place in specific settings: very high transaction volumes, rich behavioral sequences, and fraud involving images or documents, such as forged IDs. For a mid-size merchant scoring orders from a table of features, a well-tuned gradient boosting model is often the more practical choice.

How to Evaluate a Fraud Detection Model
Evaluating a fraud detection model is harder than it looks, because fraud is rare and the two kinds of errors cost different amounts. This is also where the financial stakes are highest.
Why Accuracy Misleads: The Accuracy Trap
Accuracy is a misleading metric for fraud models because a model can score very high while catching nothing. The Kaggle Credit Card Fraud Detection dataset, released by the Machine Learning Group at Université Libre de Bruxelles, shows why. It contains 284,807 European card transactions from two days in September 2013. Only 492 are fraud, about 0.17%.
A “model” that labels every transaction as legitimate gets 284,315 of 284,807 right. That’s about 99.8% accuracy with zero fraud caught.
When one class is this rare, accuracy rewards doing nothing. If a vendor or internal team leads with an accuracy figure for a fraud model, ask for precision, recall, and dollar impact instead.
Handling Class Imbalance During Training
Class imbalance affects how fraud models learn, not just how they’re scored. With so few fraud examples, a model can largely ignore them and still keep overall error low. Teams use three common fixes:
- Class weights: Tell the model that missing a fraud case costs more than misjudging a legitimate one.
- Undersampling: Train on fewer legitimate examples so fraud makes up a larger share.
- Oversampling, including SMOTE: Create synthetic fraud examples from existing ones, a technique introduced in Chawla et al.’s SMOTE paper.
Each fix has side effects. Resampling changes the fraud rate the model sees, which can distort its probability outputs. Research by Dal Pozzolo and colleagues on calibrating probability with undersampling showed that undersampling biases predicted probabilities, so teams often recalibrate afterward.
The scikit-learn guide to probability calibration explains common recalibration methods. Whatever method you use, run the final evaluation on data with the real-world fraud rate.
Precision, Recall, and the Confusion Matrix
Precision and recall are the two core metrics drawn from a confusion matrix, which sorts every prediction into one of four outcomes:
Model Evaluation Basics
The Fraud Detection Confusion Matrix
Every prediction lands in one of four boxes. Two are correct calls, and two are costly mistakes.
| Reality ↓ vs. Model → |
Model Flags It
Predicted fraud
|
Model Approves It
Predicted legitimate
|
|---|---|---|
| Actually fraud A real fraud attempt | Fraud caught The model spots the bad transaction and stops the loss. True positive ✓ Correct call | Fraud missed The fraud slips through and later turns into a loss or chargeback. False negative ✕ Costly error |
| Actually legitimate A real, honest customer | Good customer blocked A real buyer gets declined, and the sale may be lost for good. False positive ✕ Hidden cost | Good customer approved The order goes through smoothly, with no friction. True negative ✓ Correct call |
Precision asks: of everything the model flagged, how much was really fraud?
Recall asks: of all the fraud that happened, how much did the model catch? Strong fraud programs track both, because each error type carries a different cost.
- Precision: Of everything the model flagged, how much was really fraud.
- Recall: Of all the fraud that happened, how much the model caught.
The F1 score combines precision and recall into one number. It’s handy for comparing models, but it hides the fact that each kind of error usually has a different cost.
Hypothetical worked example: A store processes 200,000 orders in a quarter. Of those, 1,000 are fraudulent (0.5%), and the average order is $90.
Hypothetical Worked Example
What the Confusion Matrix Costs in Real Dollars
One store, one quarter. Here’s how each model outcome turns into fraud stopped, losses, and sales put at risk.
Outcome
What the model did
|
Count
Orders this quarter
|
Dollar Impact
At a $90 average order
|
|---|---|---|
| Fraud caught ✓ True positive | 800 80% of all fraud | $72,000 In fraud stopped before it became a loss. |
| Fraud missed ✕ False negative | 200 20% of all fraud | $18,000 In losses, before chargeback fees. |
| Good orders blocked ✕ False positive | 1,200 More than all fraud combined | $108,000 In sales put at risk, the largest cost in the table. |
| Good orders approved ✓ True negative | 197,800 The vast majority of orders | Normal revenue Honest customers check out with no friction. |
Bottom line: A 99.3% accuracy figure sounds excellent, but it hides the real trade-off. Here, blocked good orders put six times more revenue at risk than missed fraud cost.
- Recall: 800 ÷ 1,000 = 80%
- Precision: 800 ÷ 2,000 flagged orders = 40%
- Accuracy: 198,600 ÷ 200,000 = 99.3%
A 99.3% accuracy figure sounds excellent. Yet in this example, blocked good orders put six times more revenue at risk than missed fraud cost. Not every blocked customer is lost, since some retry with another card. Still, this is exactly the trade-off accuracy hides.
PR-AUC vs ROC-AUC on Imbalanced Data
This section is for readers comparing models technically.
PR-AUC is usually a better summary metric than ROC-AUC for fraud models, because it focuses on the rare fraud class. Both metrics measure performance across every possible threshold, but they behave differently:
- ROC-AUC compares the true positive rate with the false positive rate. Legitimate transactions vastly outnumber fraud, so even a large number of false positives is a small rate. ROC-AUC can look strong for a model that floods your review queue.
- PR-AUC compares precision with recall, so false positives weigh more heavily. Saito and Rehmsmeier’s 2015 PLOS ONE study showed that precision-recall plots are more informative than ROC plots on imbalanced datasets.
If a model report includes only ROC-AUC, ask for PR-AUC too. The scikit-learn precision-recall documentation shows how both are calculated.
Business Metrics That Matter More Than Model Metrics
Model metrics tell data scientists how well a model ranks risk. Business metrics tell leaders what the model does to revenue, losses, and workload.
Business Impact Metrics
Business Metrics That Matter More Than Model Metrics
Each metric tells part of the story. Here’s what each one means, what it can hide, and which team watches it most closely.
Metric
What you track
|
Plain-English Meaning
What it measures
|
What It Can Hide
Its blind spot
|
Who Cares Most
Main owners
|
|---|---|---|---|
| Approval rate | Share approved The percentage of transactions that go through. | Revenue Growth | |
| Fraud loss rate | Losses vs. volume Fraud losses as a share of total volume, often in basis points. | Finance Risk | |
| False decline rate ★ Often overlooked | Good orders declined The share of legitimate transactions the system turns away. | Customer experience Revenue | |
| Review rate | Sent to analysts The share of transactions routed to manual review. | Fraud operations | |
| Chargeback rate | Disputes vs. volume Disputes as a share of all transactions. | Payments Compliance |
Bottom line: Model metrics help data scientists see how well a model ranks risk. Business metrics show what that model does to revenue, losses, and team workload. Put a dollar cost on each error type to compare models on what really matters.
The most useful single view is cost-weighted evaluation: assign a dollar cost to each type of error, then compare models on total cost.
Hypothetical comparison: Take the same store, with 200,000 orders, 1,000 of them fraud, and a $90 average order. Assume each missed fraud costs $110 (the $90 order plus a $20 chargeback fee). Assume each blocked good order costs $30 in lost margin and goodwill. Your real figures will differ.
Hypothetical Cost Comparison
Higher Recall vs. Lower Total Cost: Model A vs. Model B
Same store, same quarter, two models. Put a dollar cost on each error, and the “better” model changes.
Model
Candidate tested
|
Good Orders Blocked
False positives
|
Missed Fraud Cost
At $110 each
|
False Decline Cost
At $30 each
|
Total Cost
What the business pays
|
|---|---|---|---|---|
| Model A 80% recall ★ Lower total cost | 1,200 Fewer honest buyers turned away | $22,000 200 missed × $110 | $36,000 1,200 blocked × $30 | $58,000 ✓ Saves $33,500 |
| Model B 85% recall Higher recall | 2,500 More than double Model A | $16,500 150 missed × $110 | $75,000 2,500 blocked × $30 | $91,500 ✕ Costs $33,500 more |
Bottom line: Model B catches more fraud and wins on recall alone. Yet it costs the business $33,500 more, because it blocks so many good customers. Those losses are easy to miss, since a declined customer rarely shows up in any fraud report.
Model B catches more fraud and would win on recall alone. It still costs the business $33,500 more, because it blocks so many good customers. These losses are easy to overlook, because a declined customer rarely shows up in any fraud report.
Testing a Fraud Model Before You Trust It
How a fraud model is tested matters as much as which metric is used. Five methods are common:
Model Validation Methods
Testing a Fraud Model Before You Trust It
How you test a fraud model matters as much as which metric you use. Here are five common methods, from historical checks to live traffic.
Method
Testing approach
|
What It Tests
What you learn
|
Risk It Reduces
What it protects against
|
|---|---|---|
| Random split Offline ⚠ Can leak future | General fit How well the model performs on a random mix of past data. | Basic overfitting Catches a model that only memorized its training data, though it can leak future patterns. |
| Out-of-time validation Offline ★ Special attention | Performance on newer data Trains on older data, then tests on newer data. | Time leakage Prevents overly optimistic results from a model that “saw the future.” |
| Backtesting Offline | Replay of past traffic How the model would have scored real transactions you already processed. | Surprises at launch Shows approval and decline impact before the model goes live. |
| Shadow mode Live traffic | Silent live scoring Scores real traffic without acting on any decision. | Lab vs. real-world gaps Reveals where live results drift from test results, with no customer impact. |
| Champion-challenger Live traffic | Head-to-head on a slice Runs a new model on a small share of live traffic against the current one. | Costly full rollouts Stops a weaker model from replacing a stronger one across all traffic. |
Bottom line: Out-of-time validation deserves special attention. Fraud patterns shift over time, so a random split lets the model “see the future” during training. Leave enough time between your training and testing windows for fraud labels to mature.
Out-of-time validation deserves special attention. Fraud patterns shift over time, so a random split lets the model “see the future” during training. Leave enough time between training and testing windows for labels to mature.
For hands-on practice, the IEEE-CIS Fraud Detection dataset from Vesta Corporation offers richer features than the Kaggle card dataset. Its training set also has a much higher fraud share, roughly 3.5%. The free Reproducible Machine Learning for Credit Card Fraud Detection handbook from ULB researchers walks through realistic validation setups. Public datasets are anonymized and often old, so results from them won’t transfer directly to a live business.
From Model Score to Business Decision
A fraud model doesn’t approve or decline anything by itself. Decision logic, built on thresholds, turns its output into actions.
How Probabilities Become Approve, Review, or Decline
Most fraud models output a probability or risk score, and thresholds split that score into action bands. A typical three-band setup works like this:
- Low risk: Approve automatically.
- Middle band: Trigger step-up authentication, such as 3-D Secure or a one-time passcode, or send to manual review.
- High risk: Decline or block.
The middle band is where step-up authentication earns its keep. Uncertain cases get asked for more proof, so the business doesn’t have to choose between letting fraud through and turning away a real customer.
Where each threshold sits should follow from the cost-weighted analysis above. If a blocked good order costs you more than a missed fraud, the decline threshold belongs higher, and more cases should flow to step-up checks instead.
Who Owns Thresholds, and When to Revisit Them
Fraud or risk teams usually own score thresholds, with input from finance and customer experience. Thresholds directly shape revenue, so they shouldn’t be set once and forgotten.
Revisit thresholds when something changes:
- After a fraud attack or a sudden jump in chargebacks
- Before and after a product launch or entry into a new market
- Ahead of seasonal peaks, such as the holidays
- After every model retrain
- When the score distribution shifts noticeably

Where Machine Learning Fraud Detection Fails
Machine learning fraud detection fails in predictable ways: drift, adversarial adaptation, cold start, bias, and opaque decisions. Knowing these failure modes is what separates a working fraud program from an expensive one.
Model Drift and Fraudster Adaptation
Fraud model performance erodes through two different forces:
- Model drift (concept drift): Legitimate behavior changes over time. Customers adopt new devices, payment methods, and shopping habits, and the patterns a model learned slowly go stale.
- Adversarial adaptation: Fraudsters actively probe defenses. They run small test transactions, learn where the limits sit, and adjust. Card testing, where criminals check stolen card numbers with tiny authorizations, is a classic example.
Drift is usually gradual, while adaptation can happen in days. New tools speed adaptation up further. In November 2024, FinCEN issued an alert on fraud schemes using deepfake media, describing criminals using generative AI to create fake identity documents and images. Fraud that looks new to a model will slip past it until labels catch up.
Teams typically respond with a mix of defenses:
- Score distribution monitoring to spot shifts early
- Scheduled retraining on fresh, matured labels
- Rules for fast response while the model catches up
- Feedback loops from analysts, who often see new patterns first
Cold Start: When There’s Little Fraud History
Cold start is the problem of training a fraud model without enough historical fraud examples. New businesses, new products, and new markets all face it.
Hypothetical scenario: A new direct-to-consumer skincare brand has three months of sales and eight chargebacks. A custom supervised model would have almost nothing to learn from.
Practical options for cold start include:
- Using a vendor model trained on consortium data, meaning fraud patterns pooled across many businesses
- Running unsupervised methods to catch obvious anomalies
- Relying on conservative rules while labels build up
- Tracking every outcome carefully so a future model has clean data to learn from
Bias and Fairness Risks
Fraud models can place uneven burdens on certain customer groups. Device, location, and identity signals often correlate with income, age, or geography. People with thin credit files, shared or older devices, or frequent address changes may be flagged more often, even when they’re legitimate.
Four practical checks reduce this risk:
- Compare decline and review rates across customer segments.
- Review features that might act as proxies for protected characteristics.
- Document why each major feature is included.
- Give flagged customers a clear path to verify themselves.
If a fraud model affects credit decisions, such as approving an account for a credit product, US fair lending rules may apply. These include the Equal Credit Opportunity Act and its implementing rule, Regulation B. The CFPB’s Circular 2022-03 confirms that lenders must give specific reasons for adverse credit actions, even when complex algorithms make the decision. Confirm your obligations with legal counsel.
Explainability and Model Risk Management
Explainability means being able to say why a model made a specific decision. Three audiences need different answers:
- Customers want to know why their payment was declined and what to do next.
- Analysts want to know which signals drove a flag so they can review it quickly.
- Examiners and auditors want to know how the model is built, tested, and governed.
The most common tool is the reason code, a short, readable explanation such as “new device and mismatched billing address.” Data scientists also use SHAP, which assigns each feature a share of credit for an individual prediction. A related method, LIME, explains a single prediction by fitting a simple model around it.
Hypothetical scenario: A customer calls support after a declined $600 order. Without explanations, the agent can only apologize. With reason codes, the agent sees “first purchase from a new device; shipping address differs from billing.” The agent can then offer a quick verification step and save the sale.
US governance context: US banks typically manage fraud models under model risk management expectations. The Federal Reserve’s SR 11-7 guidance on model risk management, issued with OCC Bulletin 2011-12, sets expectations for development, independent validation, and ongoing monitoring. The NIST AI Risk Management Framework offers voluntary guidance that any organization can use. Fintechs that partner with banks often inherit these expectations through those partnerships.
International note: The EU AI Act treats AI used for creditworthiness assessment as high-risk but explicitly excludes systems used to detect financial fraud. US companies serving EU customers should also review Article 22 of the GDPR, which covers decisions based solely on automated processing. Check current requirements against the official texts and with counsel.

Does Your Business Need Machine Learning for Fraud Prevention?
Not every business needs to build its own fraud model. Many payment processors already include some form of fraud screening, so a business may be using machine learning without realizing it. Check your processor’s documentation to see what’s included and which settings you can adjust.
A Readiness Checklist for Machine Learning Fraud Detection
Five questions show whether a business is ready for its own fraud model:
- Volume: Do you process enough transactions for patterns to emerge? A few hundred orders a month rarely supports a custom model.
- Label quality: Are chargebacks, refunds, and fraud outcomes tracked and linked to the original transactions?
- Fraud pressure: Are fraud losses, chargeback rates, or manual review costs rising?
- Team capacity: Who will monitor the model, retrain it, and tune thresholds?
- Existing tools: Does your processor already include a model, and have you tuned its settings?
If most answers are “no” or “not sure,” start by cleaning up your data and tuning the tools you already have.
Three Paths: Use, Add, or Build
Fraud Prevention Paths
Three Paths: Use, Add, or Build
Not every business needs its own fraud model. Compare who each path suits, what it gives you, and what it costs in money and effort.
Path
Your approach
|
Best For
Who it suits
|
Main Advantage
What you gain
|
Main Trade-off
What you give up
|
|---|---|---|---|
| Use a fraud platform Your processor’s built-in model ★ Start here | Small and growing businesses Teams that need protection without hiring specialists. Data: Minimal Team: Part-time | Fast and low effort Often already included. Tune the settings you have and you’re running. Control | Limited control You get little visibility into how decisions are made. Effort |
| Add a machine learning layer A specialist fraud tool Rising fraud | Mid-size merchants and fintechs Businesses whose fraud losses or review costs keep climbing. Data: Moderate Team: Fraud analyst | Specialist detection Stronger models and more control, without building from scratch. Control | Extra cost and integration Vendor fees plus the work of connecting another tool. Effort |
| Build in-house Custom fraud models Full control | Large platforms Companies with unique fraud patterns that off-the-shelf tools miss. Data: Large, well-labeled Team: Data science | Tailored to your business Full say over features, thresholds, and how decisions get explained. Control | Highest cost and upkeep Pipelines, monitoring, retraining, and governance often cost more than the first model. Effort |
Bottom line: The right path depends on your team size, how mature your data is, and how much control you need. Most businesses should tune the tools they already have first. Then they can add or build only when fraud pressure and clean labels justify the extra cost.
Pricing varies widely. Vendors commonly charge per transaction, as a percentage of volume, through platform subscriptions, or through chargeback guarantees. Get current quotes in writing and compare them against your own cost-weighted error figures.
Smaller merchants on the “Add” path can compare AI fraud prevention tools for Shopify stores. Teams weighing the “Build” path should price in more than model development. Data pipelines, label tracking, monitoring, retraining, and governance often cost more over time than the first model does.
People Also Ask
How does machine learning detect fraud?
Machine learning detects fraud by learning patterns from past transactions labeled as fraud or legitimate, then scoring new activity on how closely it matches past fraud. Models combine transaction, device, identity, behavior, and network signals. Scoring typically happens within a fraction of a second, so checkout isn’t noticeably slowed.
What is the best machine learning algorithm for fraud detection?
No single algorithm is best for every case. Gradient-boosted trees are a common strong starting point for transaction data. Many teams first train a logistic regression baseline, then check whether a more complex model beats it by enough to justify the extra effort and lower transparency.
Can machine learning detect new types of fraud?
Partly. Supervised models struggle with patterns they’ve never seen. Unsupervised methods can flag unusual activity without labels, and rules can cover gaps quickly. Vendor models trained on consortium data can also spot attacks that hit other businesses before they reach yours.
How much data do you need to train a fraud detection model?
There’s no fixed minimum. What matters most is enough confirmed fraud examples, consistent labels, and data that reflects current behavior. Because chargebacks arrive late, leave a buffer of several weeks to a few months before your training cutoff so the most recent labels have time to mature.
Is machine learning fraud detection accurate?
Accuracy is the wrong way to judge a fraud model, because a model that flags nothing can still score above 99% when fraud is rare. Ask for precision, recall, and dollar costs instead. Also ask whether those numbers were measured on newer, out-of-time data at the real fraud rate.
Why do fraud detection models get worse over time?
Fraud detection models degrade because customer behavior changes and fraudsters adapt to the defenses they meet. Early warning signs include a shifting score distribution, a falling approval rate, or a rising review queue. Catching these signals early lets teams retrain before losses climb.
Is machine learning fraud detection worth it for small businesses?
Usually yes, but through existing tools rather than a custom build. Most small businesses get machine learning protection from their payment processor or an add-on fraud tool. A good first step is reviewing your processor’s fraud settings and tracking chargebacks by order, so you know where losses come from.
Is a fraud model the same as a credit scoring model?
No. A fraud model judges whether a specific action, such as a payment or login, is legitimate. A credit model estimates whether a person will repay borrowed money. Credit models also face stricter US fair lending and adverse action rules. See how BNPL algorithms judge creditworthiness for the credit side.
The Bottom Line
Machine learning fraud detection works when three things come together. The first is clean, well-understood labels. The second is evaluation built on precision, recall, and real dollar costs rather than accuracy. The third is ongoing monitoring as fraud tactics and customer behavior shift. The algorithm matters, but it’s rarely the deciding factor.
Every fraud model balances fraud caught against good customers blocked. That balance shapes revenue, losses, and customer trust, so finance, risk, and customer experience teams should all help set it. Strong programs treat the model as one part of a system that also includes rules, step-up authentication, human review, and a working feedback loop.
Your next step: Run the five-question readiness checklist against your current setup. If you already use a fraud model, check that your reports include precision, recall, false decline rate, and cost per error, not just accuracy or fraud rate. Then map which decisions in your stack belong to rules and which belong to models, so each does the work it handles best.
Machine Learning Fraud Detection · Editorial Integrity
Sources & Citations
The official documentation, regulator guidance, technical references, public datasets, and internal explainers behind this guide to machine learning fraud detection, fraud models, thresholds, false declines, and model evaluation.
We built this guide to answer a practical question: how do machine learning fraud detection systems actually work once you look past the buzzwords? The article draws on official documentation, public research, regulator guidance, and well-known technical references to explain labels, features, class imbalance, thresholds, step-up authentication, drift, and model governance in plain English.
Where the article discusses evaluation, it uses public fraud datasets and established machine learning references to show why accuracy can mislead when fraud is rare. Where it discusses governance, explainability, and consumer impact, it leans on Federal Reserve, OCC, NIST, CFPB, FinCEN, and related materials. Tech Capital Hub’s own articles on fraud scoring models, AI fraud detection, false positives, behavioral biometrics, and graph-based fraud detection provide additional context. This article is general educational information and does not constitute financial, legal, or tax advice.
View full sources, methodology, and editorial notes
This is a practical explainer for merchants, operators, fintech readers, and curious beginners who want to understand how machine learning fraud detection works in production. We used official standards, public technical documentation, regulator guidance, academic and industry references, and Tech Capital Hub’s own related explainers where they directly support the topic.
The article was written to clarify how fraud models learn from delayed and imperfect labels, which signal groups matter most, how supervised and unsupervised approaches differ, why gradient-boosted trees are common on tabular data, and how teams should evaluate models using precision, recall, PR-AUC, and business costs rather than raw accuracy alone. We also used governance sources to explain model risk management, explainability, bias concerns, and the limits of automated decisioning. Examples marked hypothetical are teaching examples, not live business data. Public datasets and vendor materials are illustrative and should not be treated as direct evidence that the same results will hold in every real-world fraud stack.
- Official EMVCo authentication documentation: EMVCo — 3-D Secure — cited for step-up authentication context and where 3-D Secure fits between model scoring and final decisions.
- Official Stripe fraud product documentation: Stripe Docs — Radar — cited as a vendor example of machine learning-based payment risk scoring, not as an independent performance evaluation.
- Official XGBoost documentation: XGBoost Documentation — cited for the role of gradient-boosted trees as a common strong starting point for structured transaction data.
- Original anomaly detection research: Isolation Forest Paper — Liu, Ting, and Zhou — cited for how isolation forest detects outliers in unlabeled data.
- Research on tabular models versus deep learning: Why Do Tree-Based Models Still Outperform Deep Learning on Tabular Data? — cited for broader evidence that tree-based models often remain strong on medium-sized tabular problems.
- Public fraud dataset reference: Kaggle — Credit Card Fraud Detection Dataset — cited to illustrate extreme class imbalance and why accuracy is a misleading headline metric in fraud.
- Research on synthetic oversampling: SMOTE Paper — Chawla et al. — cited for oversampling as one way to address class imbalance during training.
- Research on probability calibration after undersampling: Calibrating Probability With Undersampling for Unbalanced Classification — cited for the warning that resampling can distort predicted probabilities.
- Official scikit-learn probability calibration guide: scikit-learn — Probability Calibration — cited for recalibration methods after reweighting or resampling.
- Research on PR curves versus ROC curves: The Precision-Recall Plot Is More Informative than the ROC Plot — cited for why precision-recall views are usually more informative on imbalanced fraud datasets.
- Official scikit-learn precision-recall documentation: scikit-learn — Precision-Recall Example — cited for technical background on threshold-free evaluation metrics.
- Public fraud competition dataset: Kaggle — IEEE-CIS Fraud Detection — cited as a richer public fraud dataset for validation practice and experimentation.
- Open fraud modeling handbook: Reproducible Machine Learning for Credit Card Fraud Detection Handbook — cited for realistic validation setups and fraud modeling workflow examples.
- U.S. model risk management guidance: Federal Reserve — SR 11-7 Model Risk Management — cited for governance expectations around model development, validation, and monitoring.
- U.S. banking supervisory guidance: OCC Bulletin 2011-12 — cited alongside SR 11-7 for model governance context in regulated environments.
- Official AI risk guidance: NIST AI Risk Management Framework — cited for broader guidance on managing AI risks and controls.
- Consumer finance guidance on complex algorithms: CFPB Circular 2022-03 — cited for adverse action notice expectations when complex algorithms are used in credit decisions.
- Regulation B official text: CFPB — Regulation B (Equal Credit Opportunity Act) — cited for fair lending context where fraud controls overlap with credit decisioning.
- FinCEN alert on deepfake-enabled fraud: FinCEN — Alert on Deepfake Media in Fraud Schemes — cited for how generative AI can accelerate fraudster adaptation and document fraud.
- Internal explainer on fraud scores: Tech Capital Hub — Fraud Scoring Models: How a Risk Score Is Built in Milliseconds — cited for the article’s companion explanation of how transaction risk scores become approval, review, or decline decisions.
- Internal guide to AI fraud systems: Tech Capital Hub — AI Fraud Detection — cited for the broader context around where machine learning fits inside a larger fraud stack.
- Internal guide to false positives: Tech Capital Hub — False Positives in Fraud Detection — cited for the business impact of blocking legitimate customers.
- Internal guide to behavioral signals: Tech Capital Hub — What Is Behavioral Biometrics in Banking Fraud Prevention? — cited for deeper background on human-versus-bot behavior signals.
- Internal explainer on graph-based detection: Tech Capital Hub — How Graph Neural Networks Detect Money Laundering — cited for relationship-based modeling concepts that also apply to fraud rings and linked-entity detection.
Machine Learning Fraud Detection · Editorial Standards
Our Editorial Standards
Tech Capital Hub applies Google’s E-E-A-T framework to every guide on AI fraud detection, payment risk, fraud scoring, and financial technology, including this one on machine learning fraud detection. We prioritize clear explanations, vendor-neutral analysis, official documentation, and honest trade-offs over hype or black-box claims.
In this article, we explain how fraud models work from the inside: where labels come from, why delayed chargebacks distort training data, which feature types matter most, how supervised and unsupervised methods differ, and why model evaluation must go beyond accuracy alone. Where technical or governance claims matter most, we anchor them to official documentation, public research, regulator guidance, and well-known machine learning references. We also note limits plainly: examples marked hypothetical are teaching examples, public datasets are illustrative rather than universal, and no single model or metric works best in every fraud environment. This guide is reviewed over time as documentation, threat patterns, and regulatory expectations evolve.
View how our editorial standards apply to this article
Built Around Practical Fraud Questions
We structured this guide around the questions merchants, operators, and fintech readers actually ask. What does a fraud score really mean? Why do two systems score the same transaction differently? When should a business approve, review, challenge, or decline?
We also focus on the questions that surface once a model is live: how labels arrive late, why false declines can cost more than missed fraud, when thresholds need to move, and how fraudsters adapt after you launch a model. The result is a practical explainer for real decision-making, not just a high-level definition.
Technical Concepts Explained in Plain English
This article translates core fraud modeling concepts into accessible language without stripping out the important details. That includes labels, feature engineering, class imbalance, precision, recall, PR-AUC, thresholds, model drift, and step-up authentication.
We also explain where different model types fit, from logistic regression and gradient boosting to isolation forest, autoencoders, and graph neural networks. Readers do not need a machine learning background to follow the logic, because each idea is introduced in practical business terms before technical terms are layered in.
Official and Technical Sources Where Precision Matters
We support specific claims with official or authoritative sources where accuracy matters most. That includes EMVCo documentation for 3-D Secure, Federal Reserve and OCC guidance for model risk management, NIST guidance for AI governance, CFPB materials for adverse action and fair lending context, and public technical references such as scikit-learn documentation and widely cited machine learning research.
We also use public fraud datasets and related Tech Capital Hub explainers where they add context, including companion articles on fraud scoring models, behavioral biometrics, false positives, and graph-based financial crime detection.
Vendor-Neutral, Transparent, and Clear About Limits
This article is written as a vendor-neutral method guide. No company paid for placement, and vendor examples are used to illustrate how fraud systems work, not to claim independent superiority. We also state the limits directly: public datasets are simplified, internal cost examples are hypothetical, and legal obligations vary by use case and jurisdiction.
Where fraud controls overlap with credit decisions or automated decisioning rules, we signal that readers should confirm current obligations with qualified counsel. This article is educational information, not financial, legal, or tax advice.
Machine Learning Fraud Detection · About the Author
Marcus Delray
Fintech Analyst · Founder of Tech Capital Hub
Marcus Delray is a fintech analyst and the founder of Tech Capital Hub. In this guide, he explains how machine learning fraud detection works in practice, from delayed fraud labels and feature engineering to threshold setting, false declines, and model drift. He shows how fraud models fit into a broader decision system that includes rules, step-up authentication, manual review, and ongoing monitoring, so readers can understand what these systems really do beyond the buzzwords.
View full author bio, credentials, and links
Marcus Delray has spent more than a decade researching financial technology and explaining how digital systems change the way money moves, risk gets measured, and customer decisions are made. He built Tech Capital Hub to make complex fintech topics practical for operators, investors, and curious readers who want clear, useful explanations instead of jargon-heavy summaries.
For this guide, Marcus focuses on the questions that matter most once people move past the phrase “AI fraud detection.” What data does a fraud model actually learn from? Why are chargebacks and fraud labels delayed? Why can a highly “accurate” model still be bad for the business? He breaks down supervised and unsupervised approaches, common fraud algorithms, class imbalance, precision and recall, PR-AUC, score thresholds, and the business cost of false declines in plain English.
He also explains where fraud models fail: drift, cold start, adversarial adaptation, bias, and poor explainability. Rather than treating the model as magic, he shows how it fits inside a larger system with rules, step-up checks such as 3-D Secure, manual review, and a feedback loop from outcomes. All articles are educational information, not financial, legal, or tax advice.
- Explains fraud modeling concepts such as labels, feature engineering, class imbalance, thresholds, and model drift in plain English
- Covers how machine learning fraud detection works across payments, account takeovers, onboarding fraud, and card testing detection
- Compares supervised, unsupervised, and hybrid fraud detection approaches without oversimplifying their trade-offs
- Shows why metrics such as precision, recall, PR-AUC, and cost per error matter more than raw accuracy in rare-event fraud systems
- Connects technical model behavior to real business outcomes, including false declines, review queues, customer friction, and governance risk
Enjoying our content?
Click below to add us as a preferred source. Google will prioritize our latest articles in your Top Stories, AI Mode, and AI Overviews.
Preferred Source on Google